Newly Added Content Sources
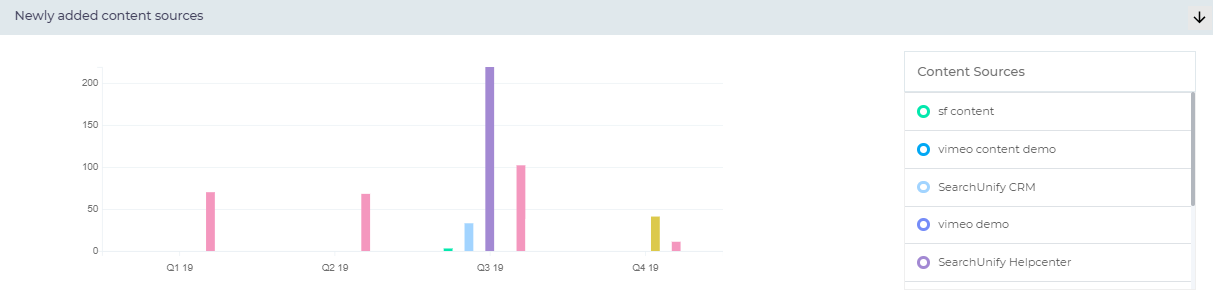
This time series bar chart shows the changes in number of documents added per content source over time (quarterly) as a series of bars. This chart is used to track how each content source is growing with time.
Download or Share
Check out Download and Share an Analytics Report
Related
- Back to Overview
Last updated: Tuesday, November 9, 2021
Was this article helpful? Send us your review at help-feedback@searchunify.com