

View API Consumption Data
The API Consumption tab displays three reports:
-
Current Quota Consumption
-
API Consumption for Previous Sessions
-
Search Consumption
These reports offer up-to-date statistics on data usage for applications created in the Get Client ID and Client Secret with an API Client. You can access these reports under API > API Consumption.
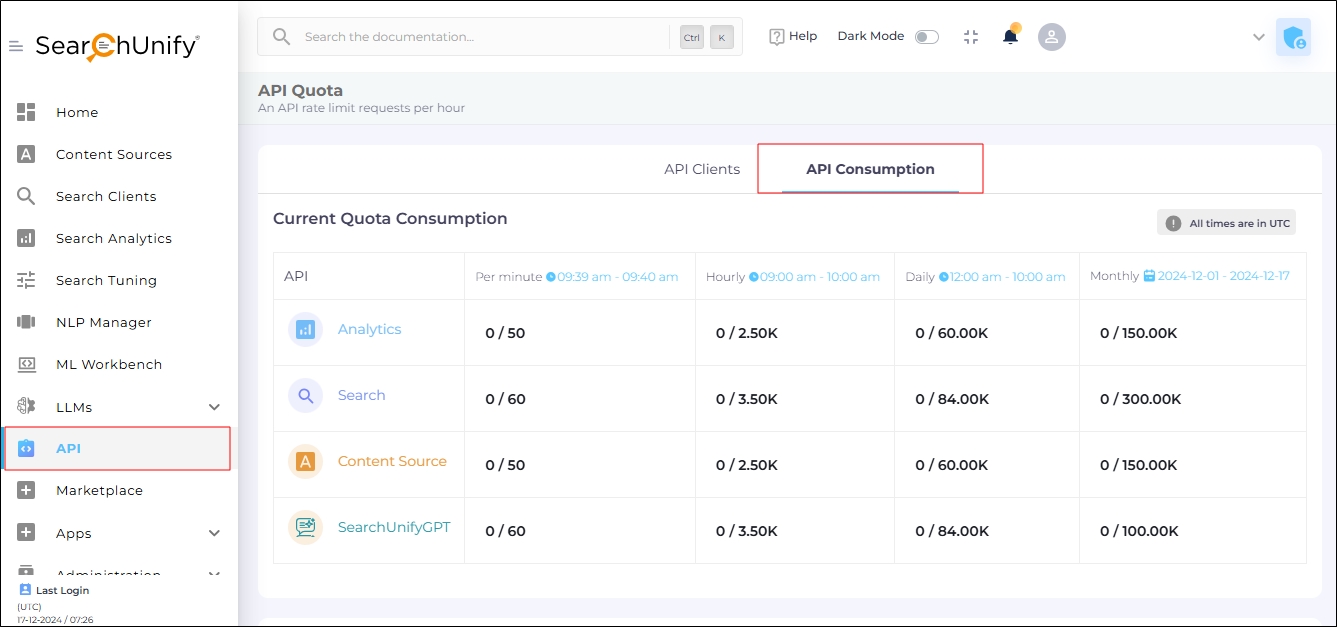
Fig. A snapshot of API Consumption in the SearchUnify Admin Panel.
Current Quota Consumption
This report displays API usage data in four categories:
-
Per Minute: Shows the API calls made in the past minute.
-
Hourly: Shows the API calls made in the past hour.
-
Daily: Shows the API calls made since 00:00 (midnight).
-
Monthly: Shows the API calls made since the first day of the month.
If you see the message "Exceeded API Quota," it means you have used all available API calls.
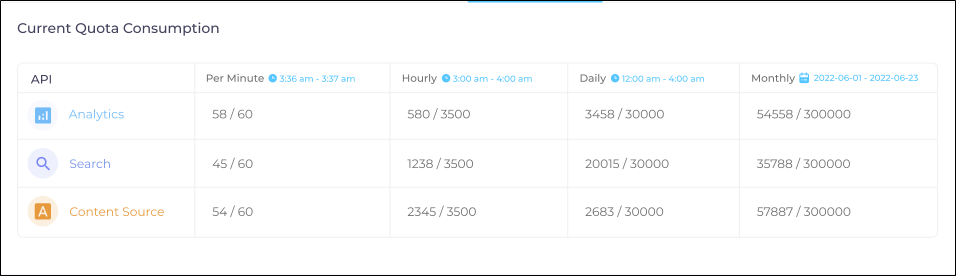
Fig. A snapshot of the Current Quota Consumption report.
API Consumption for Previous Sessions
This report shows API usage statistics for different services:
-
Search (dark blue)
-
Analytics (light blue)
-
Content Source (orange),
-
SearchUnifyGPT (green)
The report covers the selected Date Range and displays data for:
- Hourly: For Today and Yesterday.
-
Daily: For Last 7 Days, Last 30 Days, This Month, and Last Month.
-
Monthly: For Last 6 Months and Last Year.
For a Custom Period, the time range cannot exceed 30 days.
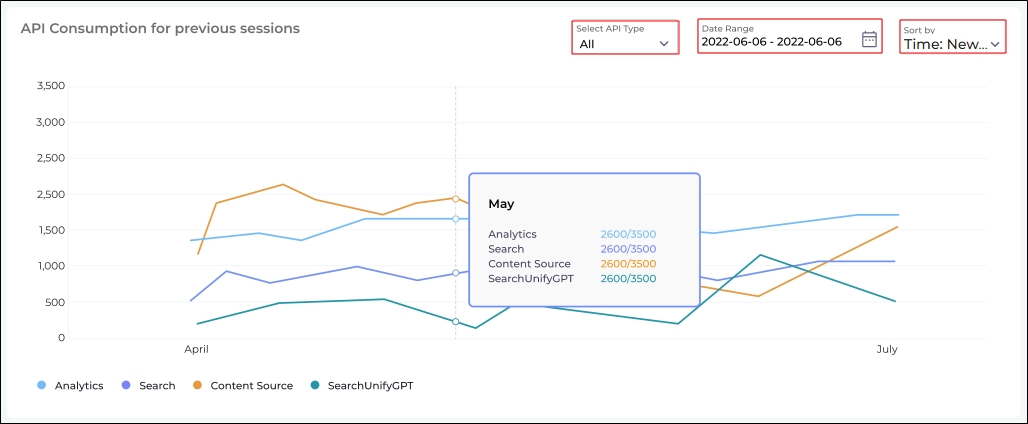
Fig. A snapshot of the API Consumption for Previous Sessions report.
The Select API Type option allows you to filter the data by API, and the Sort By dropdown lets you view consumption in two ways:
-
Chronologically: From Least Recent to Most Recent.
-
Consumption Rate: From Low to High or High to Low.
Sorting by Consumption Rate is useful for identifying when API usage peaks in terms of hours, days, or months.
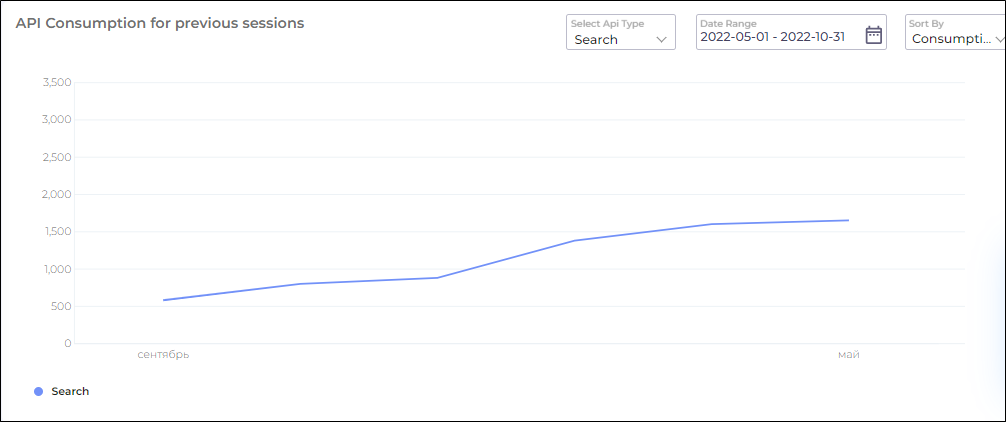
Fig. A snapshot of the API Consumption for Previous Sessions report when data is sorted by "Consumption."
In the above image, May is when the most API calls are made and September is when API consumption is at its lowest..
If you see a horizontal line in the report, it means that no API calls were made during that period.
Search Consumption
The Search Consumption graph shows the contribution of each Search Client to overall search usage. It provides detailed insights into the usage patterns of various Search Clients. This graph tracks the usage of different search types, including:
-
Auto-suggestion
-
Search Results
-
Case Form
-
REST API
By default, the Select Search Client and Select Search Type dropdowns are set to All, but you can filter the data by a specific search client and search type.
You can also filter the data by a specific Date Range and use the Sort By dropdown to organize the results.
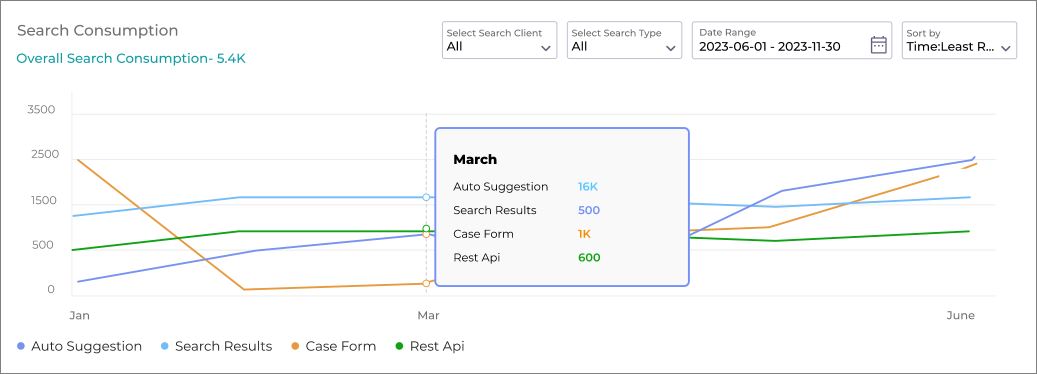
Fig: A snapshot of the Search Consumption report.