

Case Quality Auditor Analytics
The Case Quality Auditor is an AI-powered agent that evaluates the quality of closed customer support cases across all critical parameters. It automates quality assurance, reduces manual audit efforts, and ensures consistency across agents and regions. With each evaluation producing a 10-point quality score, teams can pinpoint areas for improvement and reward high performers. Currently, the Case Quality Auditor agent supports four analytics reports:
-
Overview
-
Average Sentiment
-
Average CQA Score
-
Compliance Score
-
Response SLA Compliance
-
Resolution SLA Compliance
-
-
Case QA Score Trends
-
SLA Compliance Trends
-
Case Details
Accessing the Case Quality Auditor Report
To view the analytics reports for the Case Quality Auditor, go to Analytics and select AI Case Quality Auditor from the Select AI Agent dropdown.
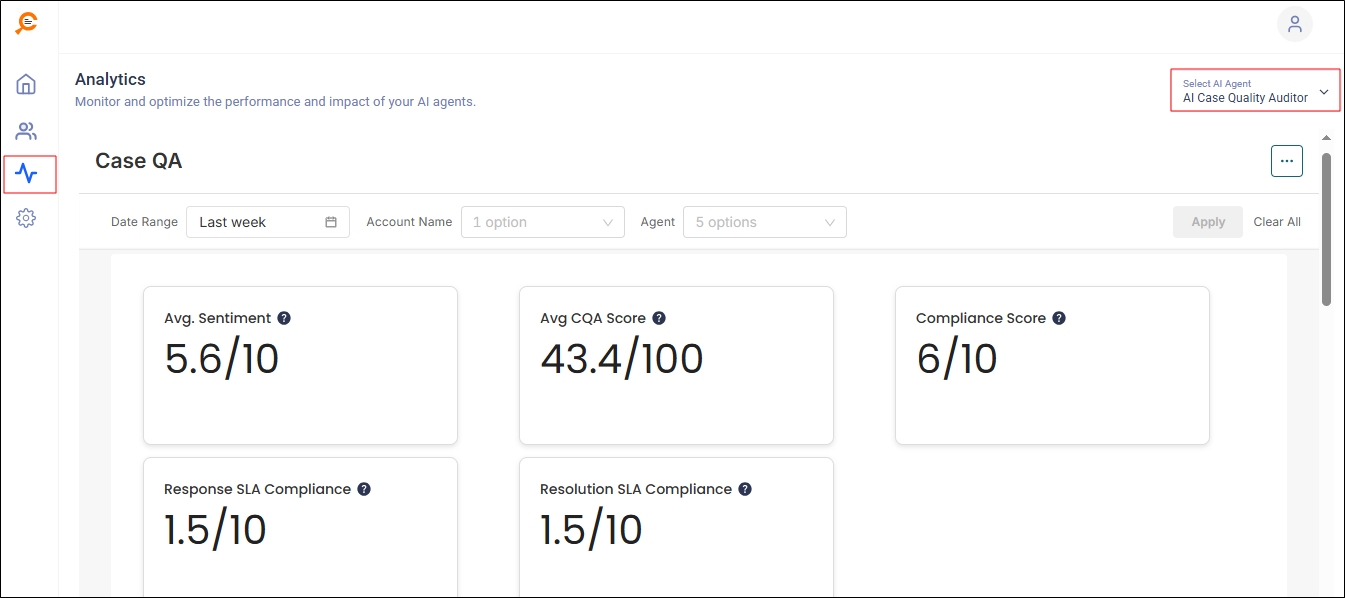
Fig. A snapshot of the AI Case Quality Auditor reports.
You will see all the reports and three filters:
-
Date Range: Select a time range for which you want to see results.
-
Account Name: View the reports only for one or more selected accounts.
-
Agent: View the reports only for one or more selected accounts.
Once you have configured the filters, click Apply.
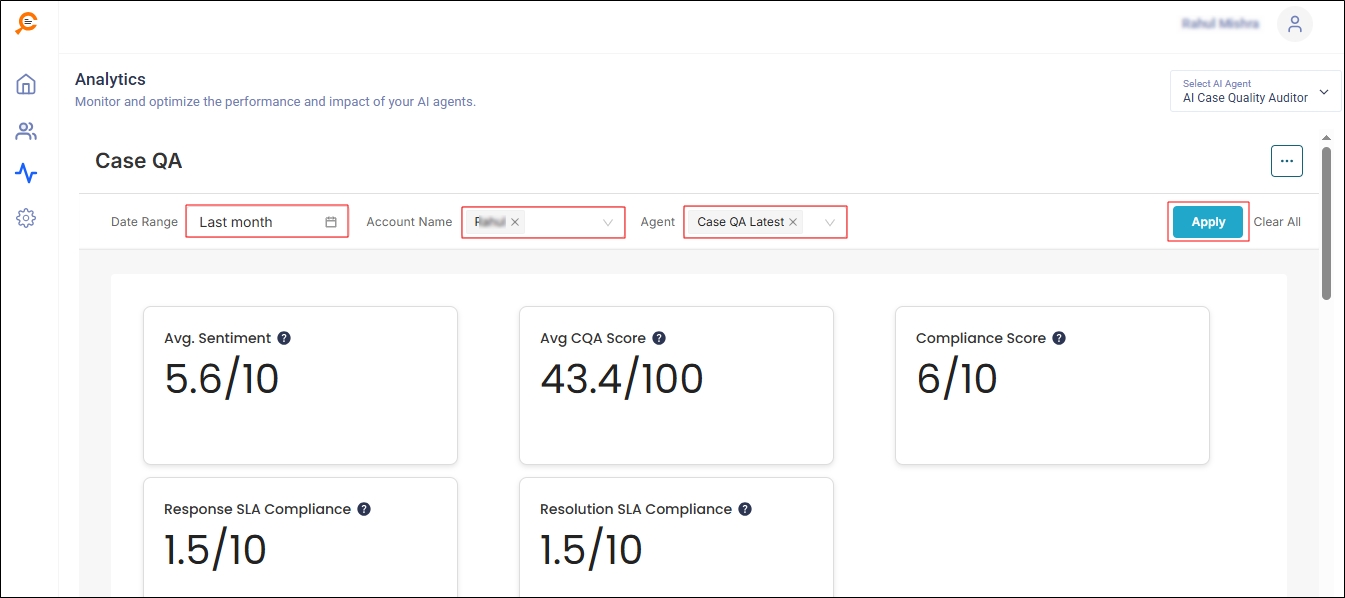
Fig. A snapshot of the filters on Case Quality Auditor analytics report.
Overview
This section contains the following tiles.
-
Avg. Sentiment: Each closed case in Salesforce is analyzed based on several factors and assigned a score. One of these factors is sentiment. Using NLP across all communication touchpoints, the agent determines the nature of the customer’s tone and assigns it a score on a scale of 1 (very negative) to 10 (very positive). Avg. Sentiment represents the average of these scores.
-
Avg. CQA Score: Besides sentiment, closed cases are analyzed on parameters such as accuracy of resolution, documentation quality, and customer engagement. Based on this analysis, each case is assigned a Case Quality Assessment (CQA) score on a scale of 1 (poor quality) to 100 (high quality). Avg. CQA Score is the average of all CQA scores assigned to cases.
-
Compliance Score: Each company has a list of parameters for which compliance is either mandatory or desired. These parameters are added to the Case Quality Auditor agent, which monitors each closed case for compliance and assigns it a score on a scale of 1 (not at all compliant) to 10 (fully compliant). The Compliance Score tile displays the average of these scores.
-
Response SLA Compliance: Each company using Salesforce typically has a service level agreement (SLA) with its clients. The Case Quality Auditor agent scores each closed case based on compliance with this agreement. The possible scores are: 1 (not at all compliant) and 10 (fully compliant). This tile shows the average of such scores.
-
Resolution SLA Compliance: Similar to Response SLA Compliance, this metric measures adherence to SLA terms for case resolution. The Case Quality Auditor agent evaluates each closed case and assigns a score from 1 (not at all compliant) to 10 (fully compliant). The tile displays the average of these scores.
-
Account at Risk: This tile displays the customer accounts that are at high risk only. It does not consider the medium and low risk accounts.
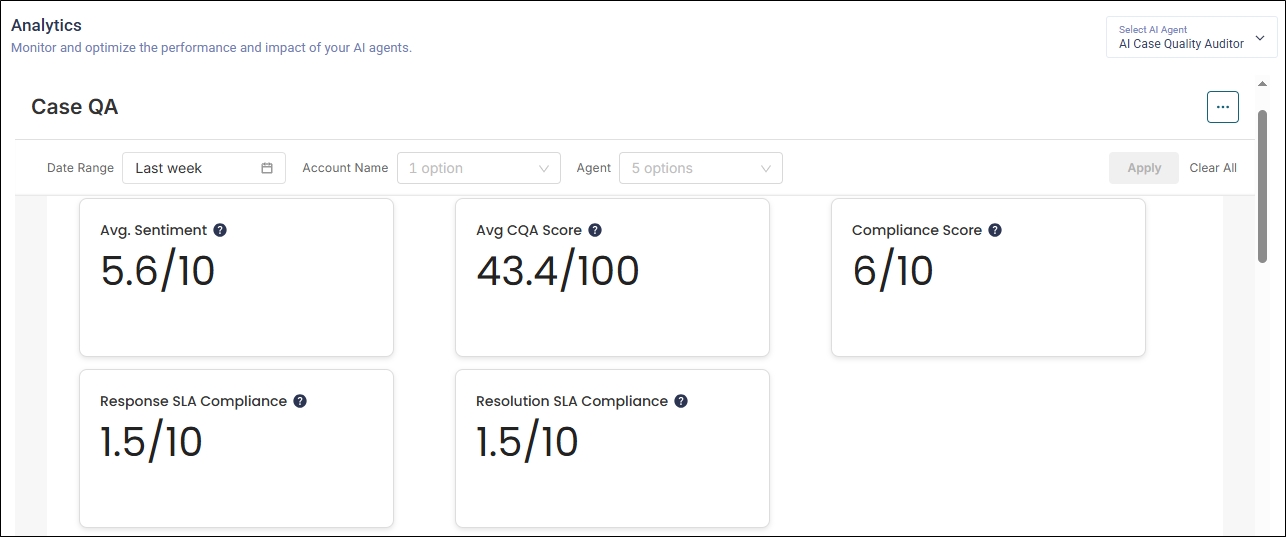
Fig. A snapshot of the five tiles in the Overview report.
Case QA Score Trends
The report displays the average QA score from the past 24 hours. You can change the period using the Date Range filter. If multiple agents are selected, you'll see a trend line for each one.
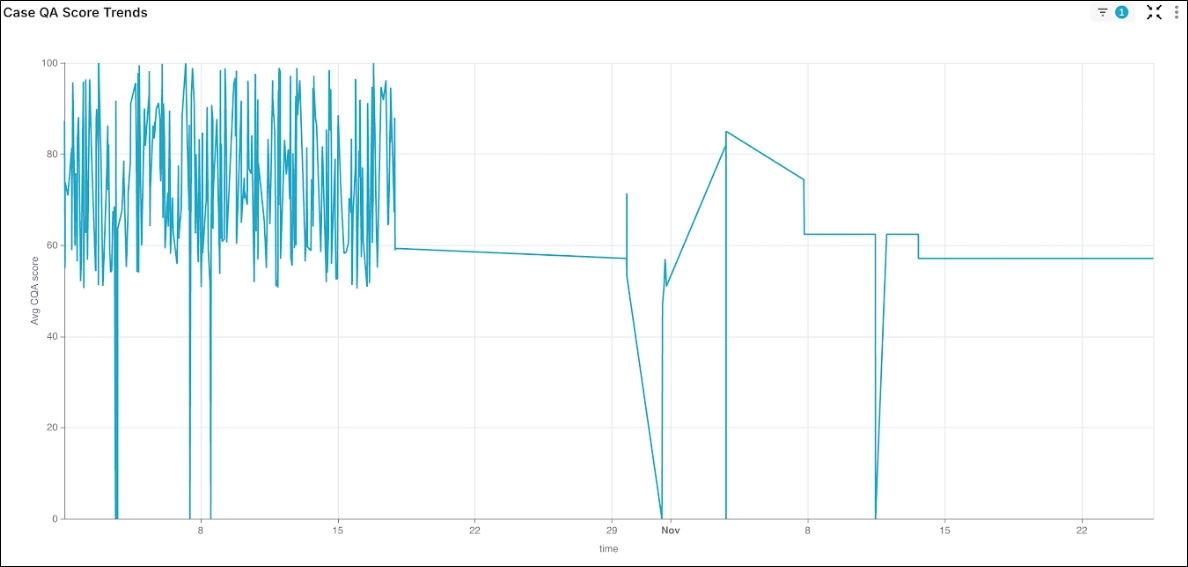
Fig. A snapshot of the Case QA Score Trends report. Each trend line corresponds to an agent; a total of three agents are shown.
SLA Compliance Trends
This report displays the average SLA compliance scores for the selected time period. You can view only the Response SLA trends by clicking on the green button or only the Resolution SLA trends by clicking on the blue button.
The All button selects both trends. displays both trends and is the default setting. Inv inverts the current selection on the report. For example, if Response SLA is selected, clicking Inv will display the Resolution SLA trends
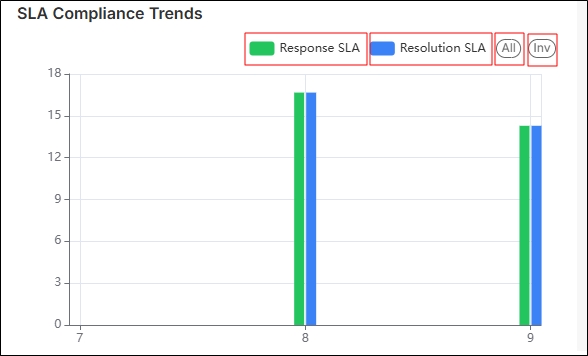
Fig. A snapshot of the SLA trends report.
Accounts at Risk
The Accounts at Risk report identifies customer accounts that are at risk due to the parameters selected by an admin. In this report, an account represents case data evaluated for a specific agent. The report helps admins determine:
-
Which condition(s) indicate account risk
-
What score is considered unacceptable performance
-
How they contribute to the overall risk score
The results of these configurations are displayed in the Accounts at Risk report. It displays:
Account Name
It displays the customer account name. Click on it to view the scores for each case parameter.
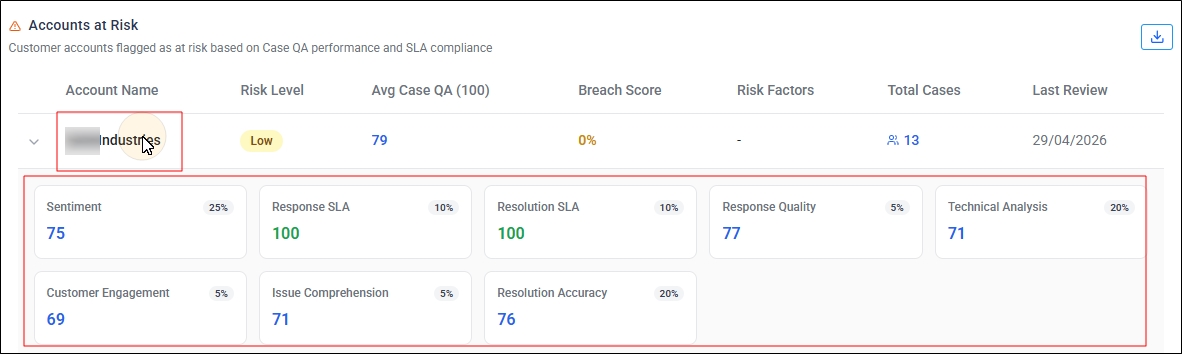
Risk Level
It can be in one of the three states based on the Break Score: High, Medium, or Low. For information on how to configure Risk Level, check the Account Risk section on Basic Configuration for AI Case Quality Auditor. The tab has been introduced into the Advanced Configuration section in the Q2 ‘26 release.
Breach Score
It is the weighted percentage of breached parameters. For example, if the report includes eight parameters and two do not meet their thresholds, the breach score is calculated as ((breached_P1_weight + breached_P2_weight) + (breached_P3_weight + breached_P4_weight)) / sumofbreachedparamenters(i.e.4) expressed as a percentage.
The algorithm for calculating the Breach Score is:
-
Get the average parameter score for each account for all its evaluated cases.
-
Compare each parameter score with its threshold. Here, the threshold value represents the starting range of the “Meets Standard” category for the selected parameter, as defined in the Threshold tab. If the parameter score is less than its threshold, mark it as a breach.
-
Multiply the parameter score with its risk weight to find the Weighted Break Score
-
Assign the risk band (High, Medium, or Low)based on configured severity thresholds.
Risk Factors
This column displays only the parameters whose score is below the threshold.
Total Cases
In this column, you can find the number of cases evaluated for the account; click the Case Detail number to view case-level information. The info in the expanded window matches the Case Details section below.
Case Quality Score
It is the average Case QA score of all the evaluated cases in that account.
Last Review
The date of the most recent case QA evaluation.
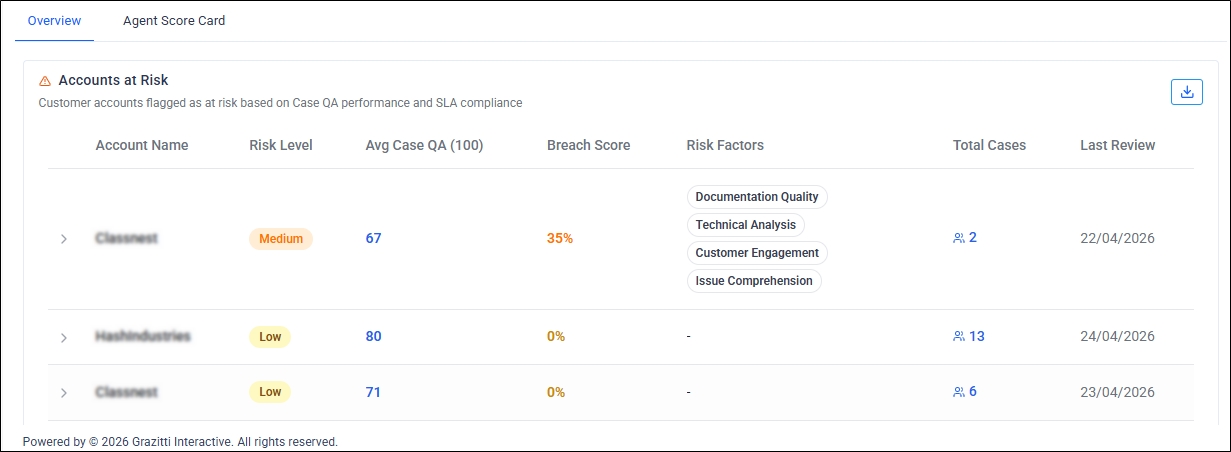
Fig. A snapshot of the "Accounts at Risk" report in Case Quality Auditor Analytics.
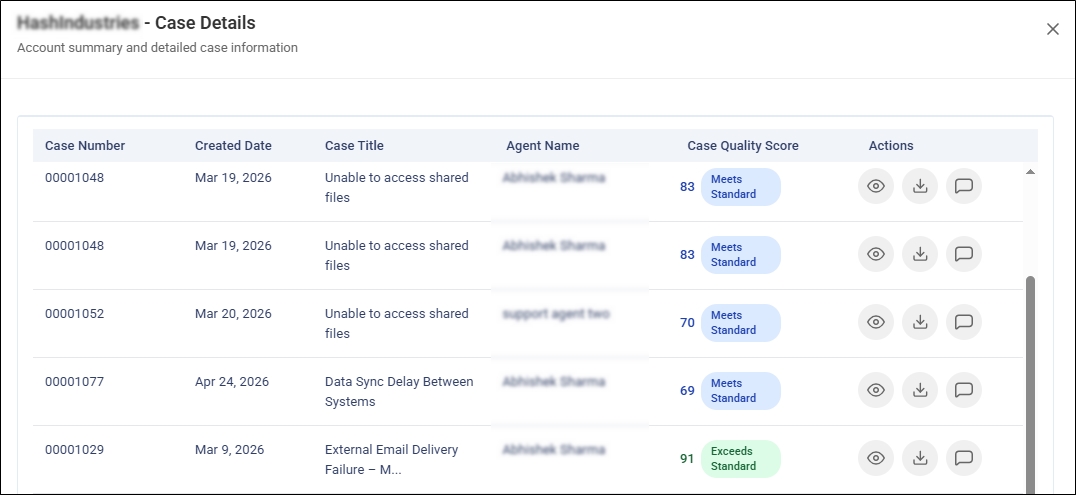
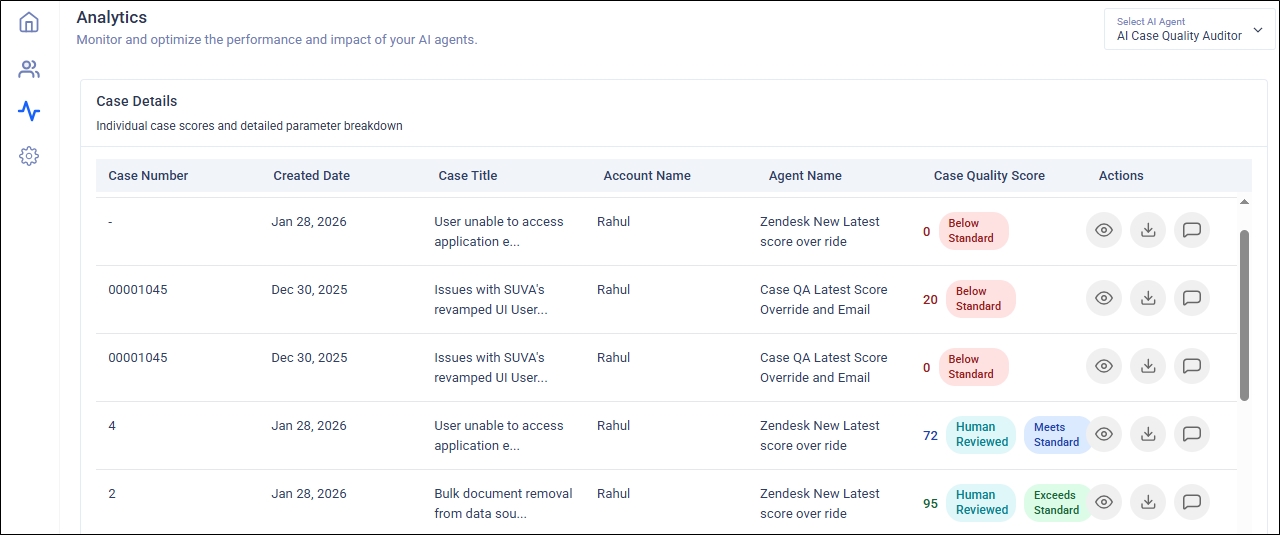
Case Details
Prerequisite: This report assumes that an addition SLA setup has been configured on your org.
This report displays a list of all cases closed over a specified time period. It includes the following columns:
-
Case ID SU — SearchUnify internal case identifier (if available).
-
Case Number: The case ID in Salesforce or Zendesk.
-
Created Date: The date when the case was created.
-
Case Title: The subject of the case.
-
Account Name: The account associated with the case.
-
Agent Name: The agent who handled the case.
-
Case Quality Score: The overall quality score for the case. For details on this column, check the next column Case Quality Score.
-
Actions: This column offers three options:
-
View Details: Click to view and edit Parameter Scores.
-
Download Audit Report: Download a complete summary of the case as a PDF file.
-
Feedback: View AI-generated feedback on how the agent handled this particular case.
For details on this column, check the next column Actions.
-
Case Quality Score
Once a case is closed, the case and its comments are analyzed and a score is given to them on the following parameters:
-
Sentiment Score displays the overall customer sentiment across all communication touchpoints.
-
Compliance & Security Adherence Score displays the adherence to mandatory guidelines. It checks if the security and privacy policies were following and if the sensitive information was handled appropriately.
-
Case Documentation Quality Score assigns a score to the clarity and completeness of the case summary.
-
Resolution Accuracy Score verifies the correctness of the proposed solutions or actions to address the customer's issue.
-
Technical Analysis Score evaluates the technical analysis conducted by the case owner. The evaluation is performed on the ability to identify and document the root cause, efficiency shown in resolving the case, and cross-team collaboration.
-
Response SLA Score tracks if the first response was provided within the SLA timeline.
-
Resolution SLA Score tracks if the final resolution was delivered within the SLA period.
-
Response Quality Score analyzes grammar, tone, empathy, and clarity in agent replies.
-
Issue Comprehension Rating detects if the case owner understands the context and purpose of the case based on the description provided by the requester. It verifies that the assigned case owner has requested all relevant information required for troubleshooting.
-
Customer Engagement indicates if the agent provided timely and proactive updates to the customer.
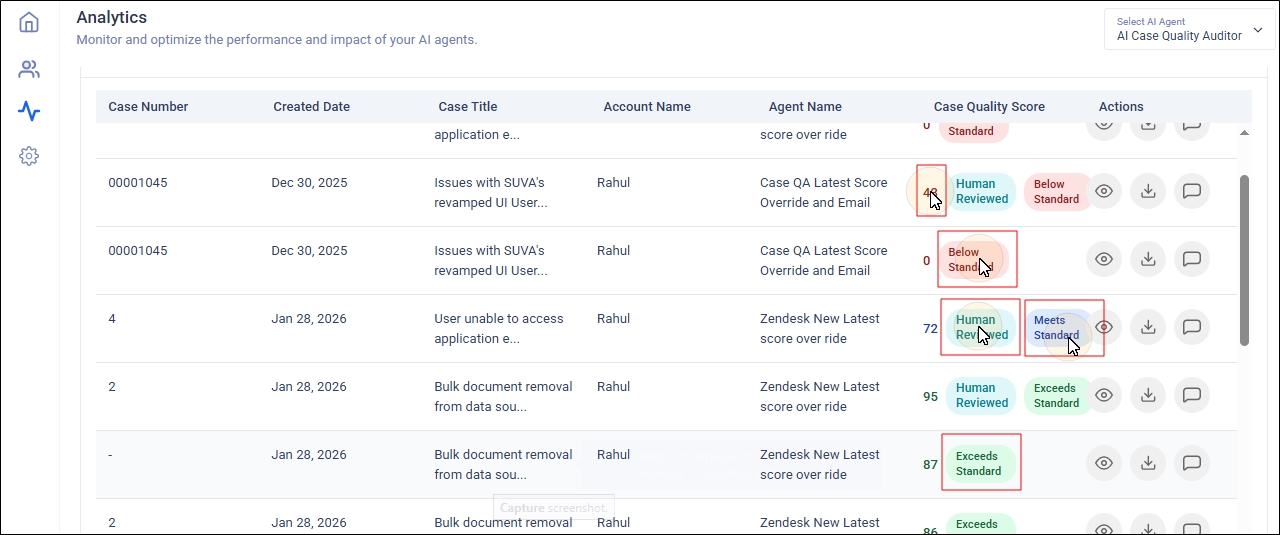
The score on the scale 1 to 10 is given on each parameter and Case Quality Score is the average of all the scores. The score is displayed in the Case Quality Score. Along with the Case Quality Score, short messages are displayed to help the admins analyze the score. One of these four messages are displayed:
-
Below Standard: The Case Quality Score doesn't meet the quality standards.
-
Meets Standard: The Case Quality Score meets the quality standards.
-
Exceeds Standard: The Case Quality Score exceeds the quality standards.
-
Human Reviewed: The Case Quality Score has been reviewed by a human. The process of human reviewing has been explained next.
Besides the Case Details report, the Case Quality Report is also shared with you over an email. The report provides information on:
-
how well the agents performed on a case
-
which parameters scored lower
-
what the customer sentiment was
-
why the score was awarded
-
what actions to improve next time
-
SLA compliance
-
document & technical depth quality
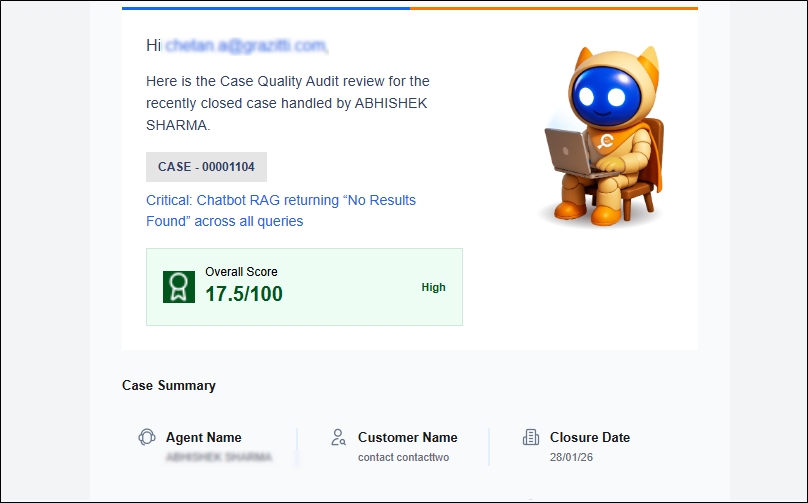
An automated Case QA Email helps drive transparency, quality ownership, and agent performance improvement. Each email contains:
-
Case ID and Case Title
-
Overall Score
-
Case Summary
-
Agent Name
-
Case Age
-
Customer Name
-
Initial Sentiment
-
Closure Date
-
Final Detected Sentiment
-
-
Parameter Scoring
-
Sentiment Score
-
Compliance & Security Adherence
-
Case Documentation Quality
-
Resolution Accuracy
-
Technical Analysis
-
Response SLA
-
Resolution SLA
-
Response Quality
-
Customer Engagement
-
Issue Comprehension
-
-
Coaching Recommendations
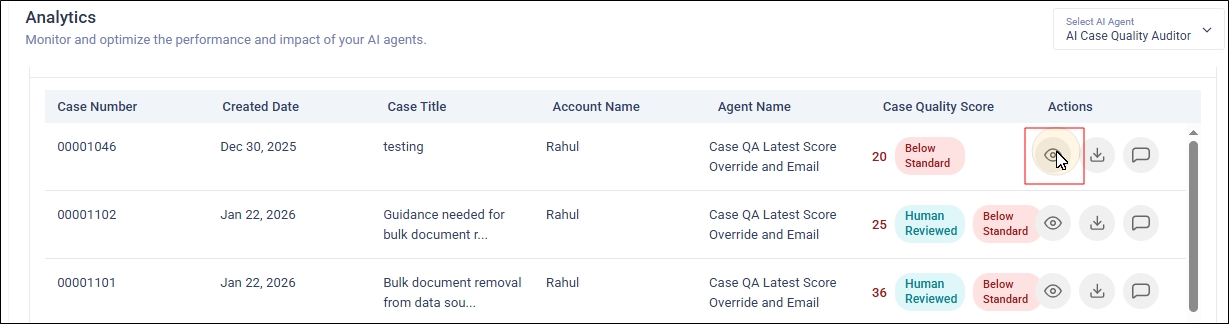
Human Reviews
You can override AI-generated quality scores for individual cases using the Eye Icon in the Actions column. The feature allows you to record a detailed reason to ensure accurate scoring, maintain transparency. This feature is an essential safeguard to ensure fairness, accuracy, and transparency in customer support quality audits. Automated scoring systems can sometimes misinterpret real-world complexities, where the agent does everything right and still gets unfairly penalized.
Note: You have to have the right set of permissions to use this feature.
The Score Override feature solves this by allowing authorized managers or QA leads to correct scores with proper justification and approval. This feature maintains credibility in the QA process and protects agents from unfair scoring. The agent morale never runs snow and the leadership sees accurate and trustworthy data.
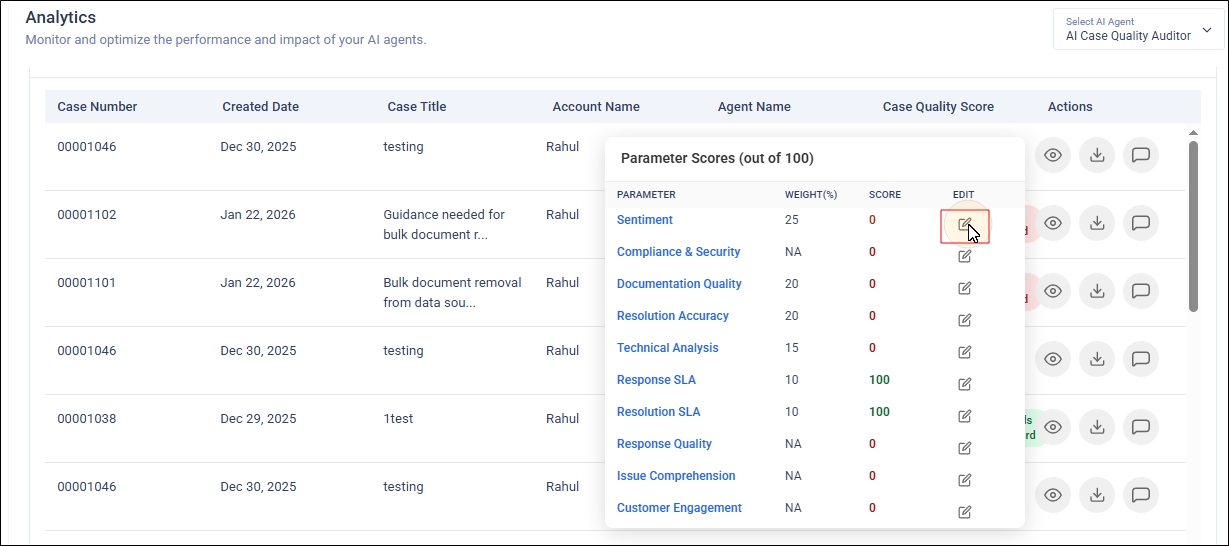
To start, click the Eye Icon.
Click the Edit icon for a parameter.
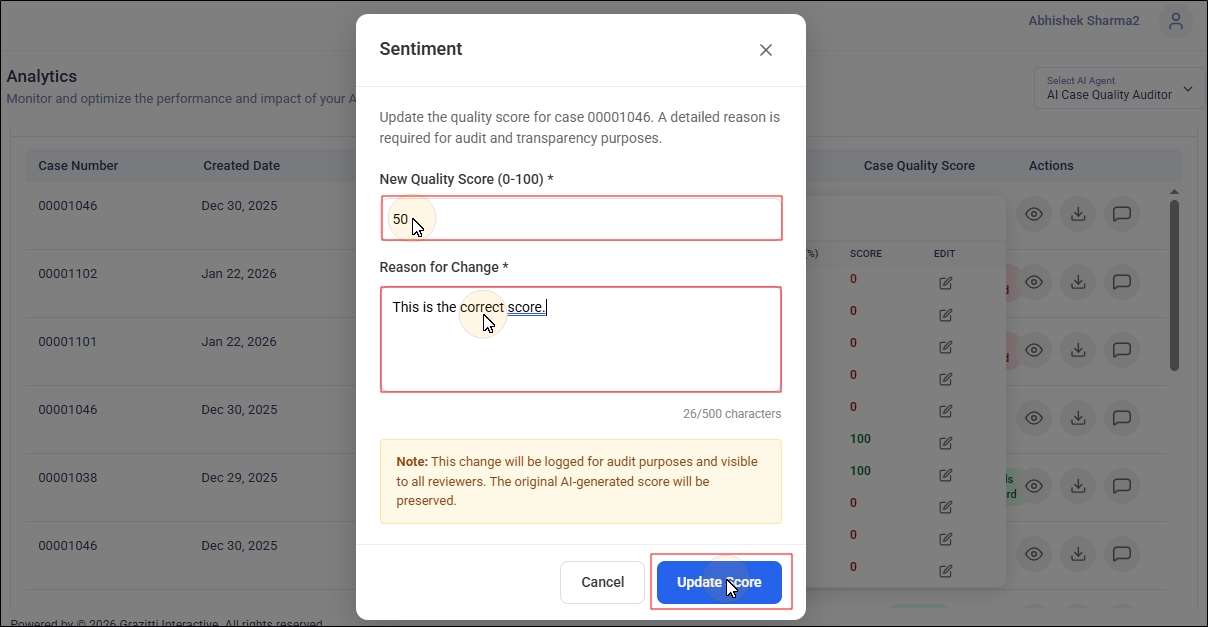
Enter the new score and the reason for changing the score. Entering the Reason for Change is mandatory. There should be at least 10 characters in the Reason for Change box. Click Update Score.
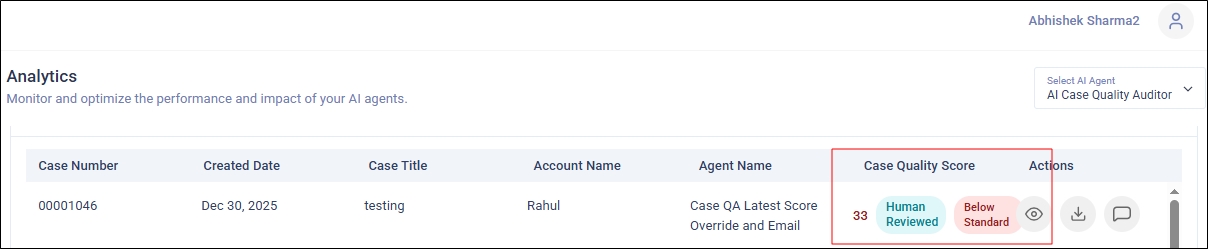
Now the new Case Quality Score will be reflected in the Case Details report along with the "Human Reviewed" message. The old score isn't deleted. It is maintained for reference.
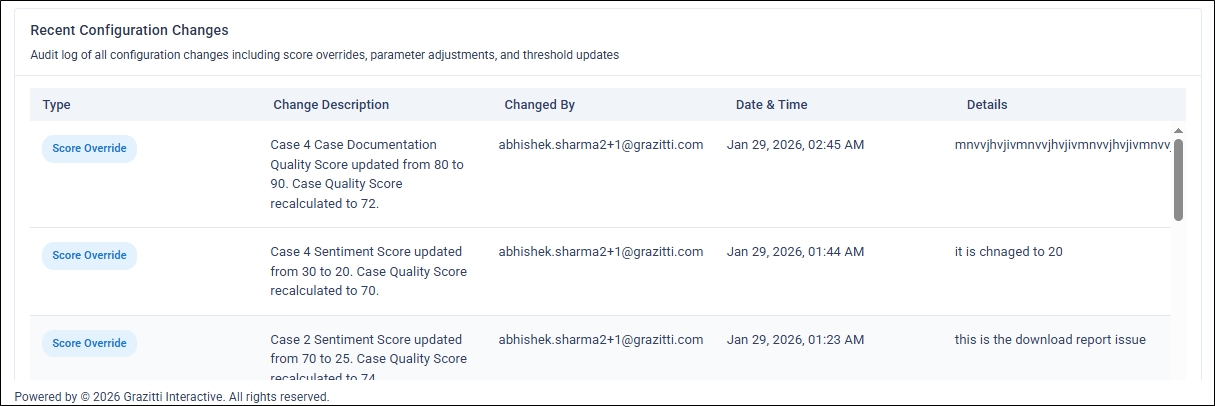
The shared feedback can be viewed by scrolling down to the Recent Configuration Changes table.
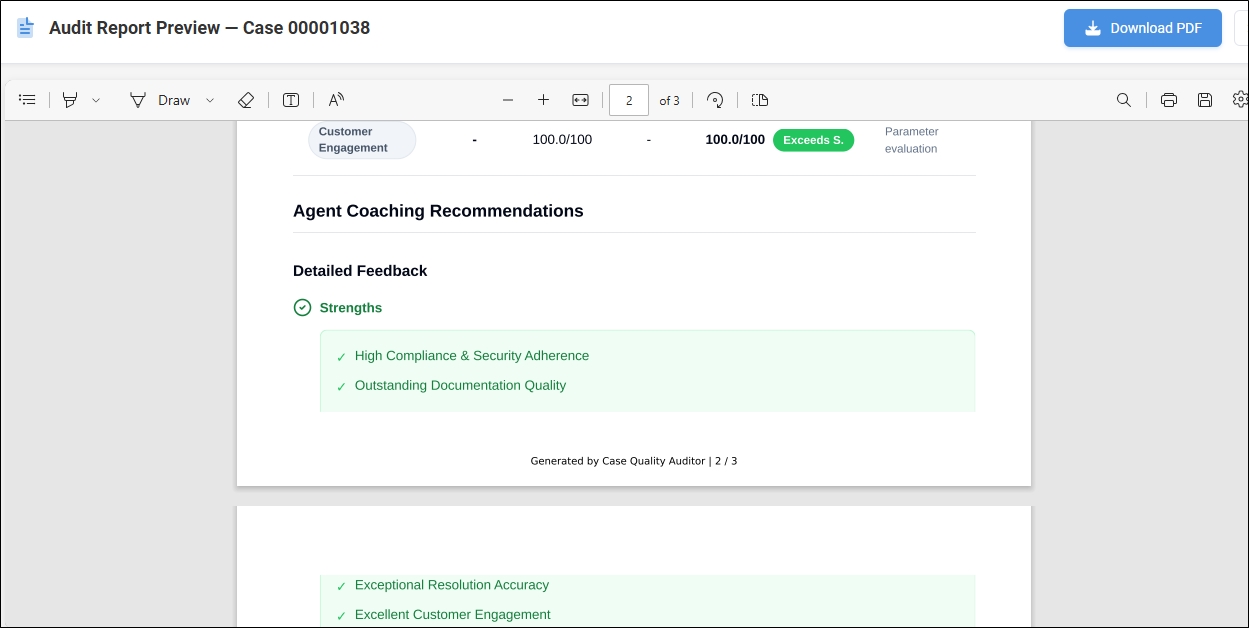
Download Case Audit Report
Support Managers, QA Managers, and Customer Success Managers complete Case Quality Audit Reports as a PDF files. The PDF reports help the managers later on take decisions on where to:
-
Override scores
-
Add qualitative comments
-
Validate or adjust AI findings
To download the Case Audit Report as a PDF file, click the Download Audit button in the Actions column.
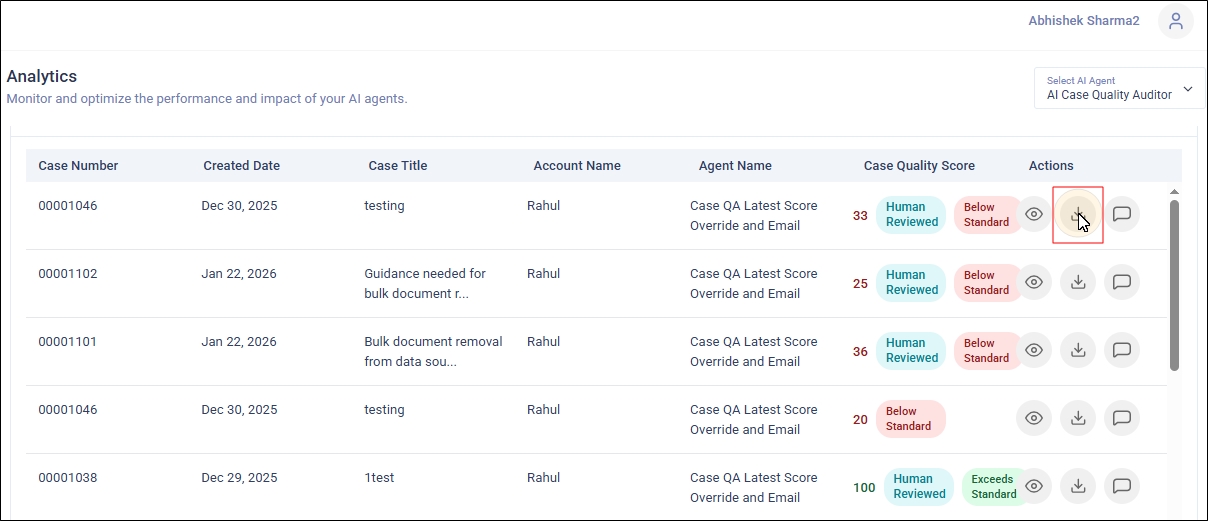
The downloaded report contains detailed information about the case. It provides:
-
Case Summary
-
Score Overview
-
Case Quality Score
-
Sentiment Score
-
-
Parameter-wise Breakdown [of scores]
-
Agent Coaching Recommendations
-
Strenghts
-
Areas for Improvement
-
-
Attachments
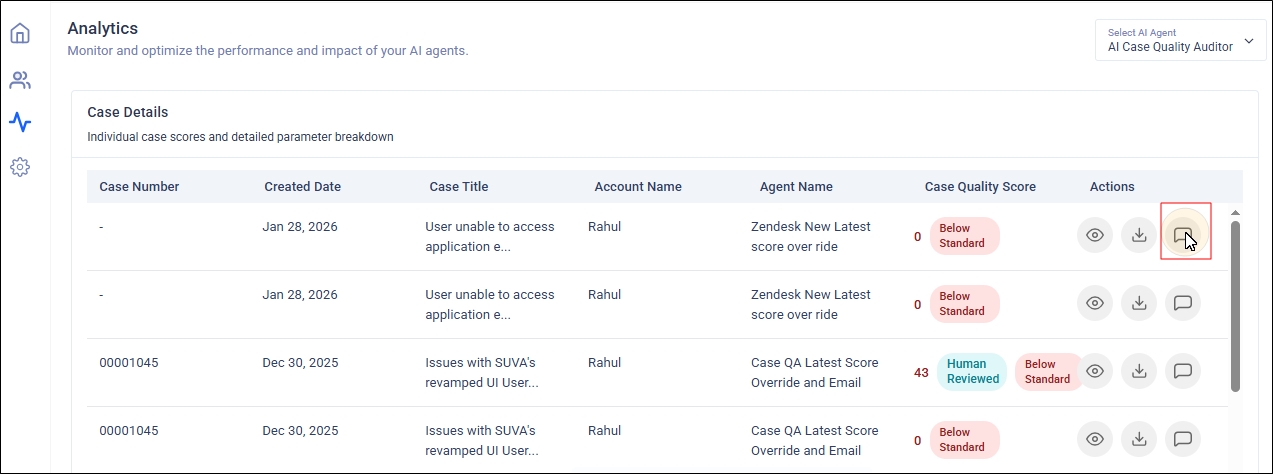
Feedback
After a case has been closed, the Case Quality Auditor produces consistent and structured "AI-Generated Feedback" reports for the agent. Each feedback report is specific to each closed case. Each report contains actionable items. Support managers can save a lot of time by reading the AI-generated feedback instead of writing each feedback manually.
You can view it by clicking the Feedback icon in the Actions column.
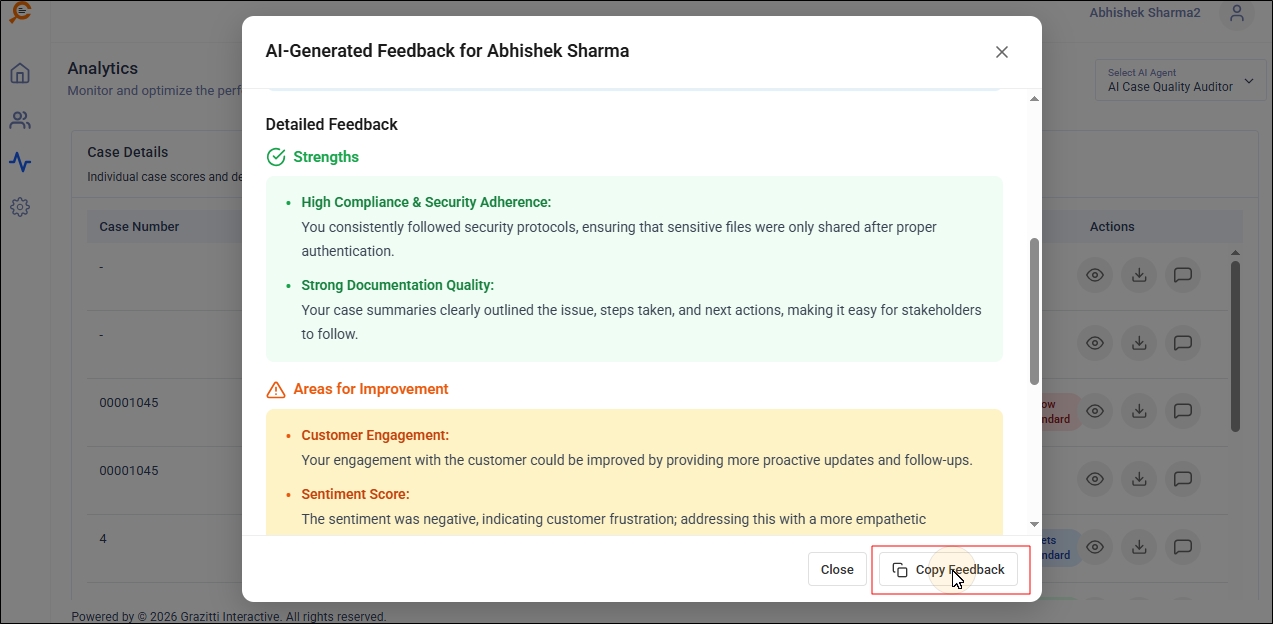
The Feedback contains:
-
Case Overview: Essential information on the case, such as the account name, case ID, agent performance score, and other details.
-
Agent: The agent who worked on the case.
-
Account: The account that logged the case.
-
Case ID: The case ID in Salesforce or Zendesk.
-
Date: The time when the case was logged.
-
Agent Performance Score: It's obtained by the formula Agent Performance Score = (Sum of Case Quality Scores) / (Total number of cases).
-
Case Quality Score: It is the average of the key case quality parameters. It's given on a scale of 1 to 100.
-
Escalation Change: The change in the probability of escalation.
-
Case Title: The title of the case.
-
-
Case Summary: A short summary of how the agent solved the case. It consists of two or three sentences.
-
Detailed Feedback
-
Strengths: The position actions taken by the agent to solve the case. It contains between three and five bullet points.
-
Areas for Improvement: The areas where the agent can improve. It contains between one and three bullet points.
-
Recommendations: A collection of recommendations to the agent. It contains between two and four bullet points.
-
You can click Copy Feedback to copy all the feedback to the clipboard.
Note: You’ll see N/A in two scenarios:
The field doesn’t exist in the source,
You don’t have permission to view it.