

Agent Helper Analytics > Agent Helper Adoption
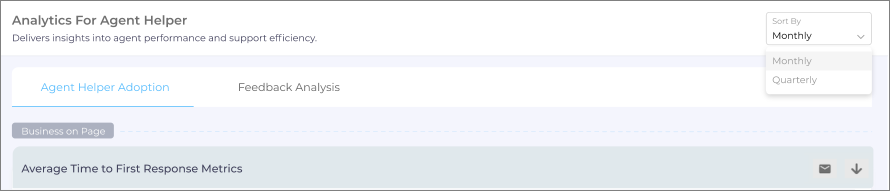
The Agent Helper Adoption report summarizes essential metrics for decision-makers whose goal is to analyze the adoption of Agent Helper by their support reps. This report shows the key metrics to analyze how the use of Agent Helper is helping to solve customer cases quickly.
The report further consists of three sub-reports namely Agent Helper Adoption Metrics, Average Time to First Response Metrics, and Case Escalation Metrics. All three reports can be sorted on a Monthly and Quarterly basis.
Agent Helper Adoption Metrics
This report analyzes the data for the last six quarters:
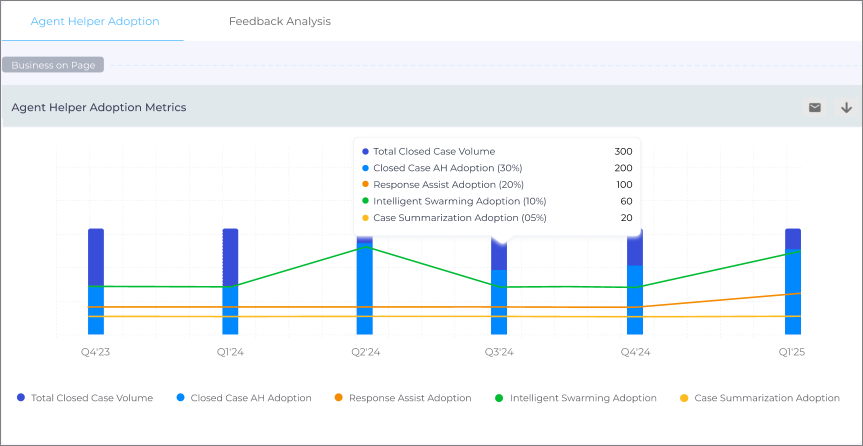
Fig: The above image shows the Agent Helper Adoption Metrics report.
Total Closed Case Volume
It shows the number of cases that have been resolved and closed during the selected months or quarters.
Closed Case AH Adoption
It shows the number of cases that were closed after the support agent interacted with the Agent Helper console at least once during case handling. Adoption is counted when an agent interacts on any element within the Agent Helper console. This includes, but is not limited to, clicks, tab access, selections, edits, and other console-level interactions in Agent Helper.
Response Assist Adoption
It shows the total number of cases in which support reps interacted with the Response Assist section of the Agent Helper console at least once. Any interaction with any element within the Response Assist section is considered adoption.
Intelligent Swarming Adoption
It shows the total number of cases that were closed with the use of the case swarming feature, which means the case details were shared on slack channels. It also shows the percentage of cases closed with use of case swarming feature.
Case Summarization Adoption
It shows the total number of cases in which support reps interacted with the Case Summarization section at least once. Any interaction with any element within the Case Summarization section is considered adoption.
Response Assist Adoption Metrics
The Response Assist Adoption Metrics report provides deeper insights into how agents engage with Response Assist within Agent Helper. It helps Support Leaders and Customer Success Managers measure adoption, identify training needs, and evaluate overall impact on agent productivity.
Go to Agent Helper → Adoption Report → Filter by → Response Assist to access the detailed adoption view.

Fig: A snapshot of Response Assist Adoption Metrics analytics section on the Adoption tab.
The dashboard includes detailed usage metrics based on agent interactions within the Response Assist experience. Any interaction with any Response Assist element can contribute to adoption tracking. These interactions may include tab access, regeneration, editing, AI-assisted refinement, copy actions, save actions, and other supported interactions within the Response Assist console area.
How Adoption is Calculated
Response Assist adoption is calculated based on whether a support rep interacted with any element within the Response Assist section of the Agent Helper console during case handling. If at least one such interaction occurs for a case, that case is counted toward Response Assist adoption.

Example:
If there are 600 total tickets where Agent Helper was used and the “Tab Opened” action occurred 400 times:

Similarly, if “Response Saved” was clicked 80 times:

Note: Adoption reflects engagement with the Response Assist experience and is not limited to a fixed subset of actions. Any supported interaction within the relevant console area may contribute to adoption.
The dashboard includes key sub-metrics and usage actions, such as:
-
Number of Tickets - Number of tickets where Agent Helper was used at least once.
-
Tab Opened – Number of times the Response Assist tab was accessed.
-
Regenerate – Number of times alternate responses were generated.
-
Edit Mode Clicked - Usage count of in-editor modifications to AI-generated responses.
-
AI Editor Clicked – Number of times the AI Editor tool was used.
-
Response Assist Copy (%) – Number and percentage of occurrences where the generated responses were copied.
-
Responses Saved (%) - Number and percentage of occurrences where the generated responses were saved.
Average Time to First Response Metrics
This report analyzes the data over the last six quarters and shows the report segmented into the metrics given below.
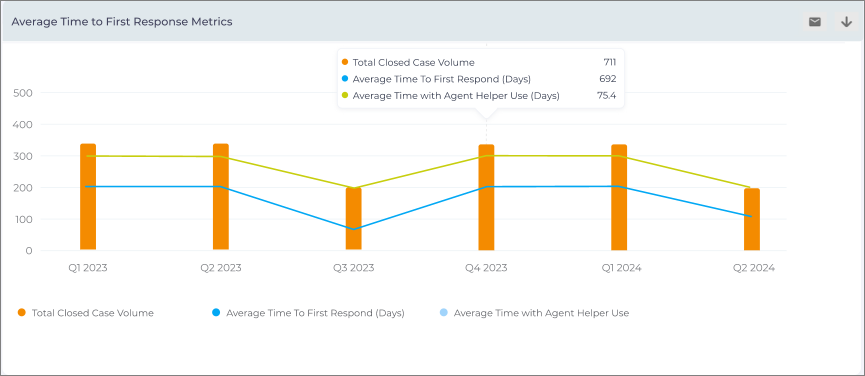
Total Closed Case Volume
It shows the total number of cases closed during the selected months or quarters.
Average Time To First Response (Days)
It shows the average time (in days) taken by support agents to respond to customer cases. The first response is the first comment added by your support reps to a case. This involves the first responses added through Salesforce, Email, Agent Helper, and other mediums.
Response Time with Agent Helper Use (Days)
It shows the average time (in days) taken by support agents to respond to customer cases using the Agent Helper console. It is tracked via clicks on Actions tabs to Copy and Regenerate buttons.
Case Escalation Metrics
This report highlights the trend of case escalation over time and shows the number of escalated cases against the number of closed cases in the selected duration.
The Case Escalation Metrics report helps the leadership analyze the efficiency of their support to manage the customer cases.
Total Closed Case Volume
It shows the number of cases closed in your CRM tool within the selected duration (either in months or quarters).
Average Time To First Response (Days)
It shows the total number of cases that were escalated in your CRM within the selected duration (either in months or quarters). It also shows the Escalation percentage, which is calculated using the following formula.

Download and Email Reports
You can download the reports or send them as email to your inbox. A .csv file is downloaded or is sent via email based on the option you used.
Daily Reports Emailed to the Admins
As an Agent Helper admin, it is imperative to track adoption by support agents regularly. Two key reports are emailed to admins every 24 hours:
-
Daily Response Usage and Modification Analysis Report
-
Daily Feature Adoption Report
Daily Response Usage Report
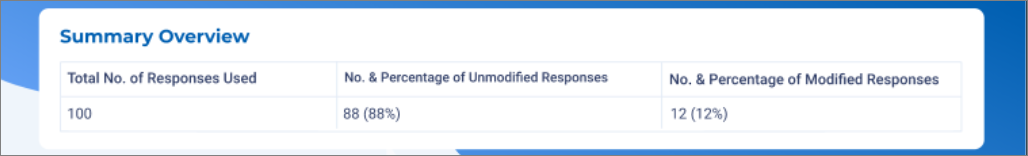
The Daily Response Usage Report tracks the responses generated by Response Assist that were either used as-is or were modified by agents.
This report includes a summary with:
-
The total number of responses used by support agents
-
The number and percentage of unmodified responses
-
The number and percentage of modified responses
Additionally, this report lists the Response Assist answers used (as-is vs. modified). The detailed report is emailed to the Agent Helper admins every morning at 10:00 AM (UTC). The emailed report has a structure as given below:
| Column | Description |
| Case Number | Lists the case numbers where responses generated by Response Assist were used. |
| Suggested Response | Displays the response generated by Agent Helper’s Response Assist for each case number. |
| Modified (Yes/No) | Indicates whether the response was modified by an agent. Yes means it was modified, and No means it was used as-is. |
| Date & Time Sent | Shows the exact date and time at which the response was used by a support agent. |
An example of the email report is shown in the image below.
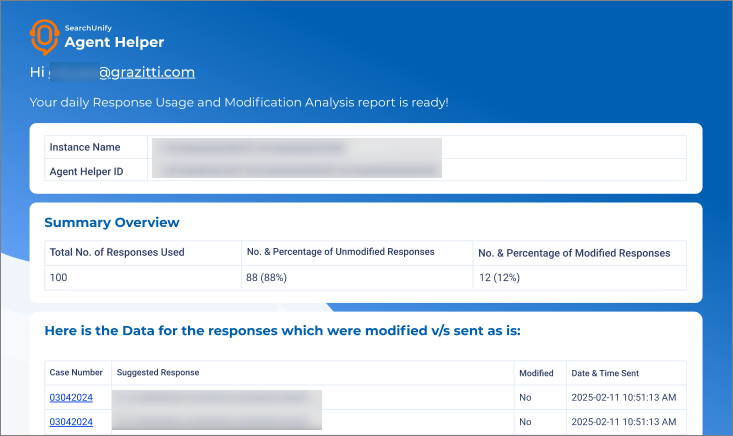
Fig: The above image shows the email template of Daily Response Usage report.
Daily Feature Adoption Report
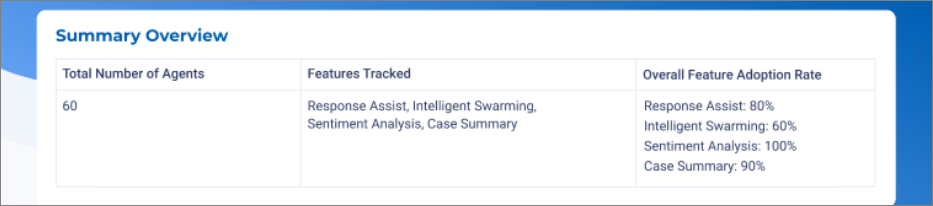
The Daily Feature Adoption Report provides adoption metrics that track how support agents interact with the Agent Helper console and its available elements. This report helps admins understand agent engagement, monitor usage patterns, and identify areas where enablement or optimization may be required.
A Summary Overview of the report is included, which highlights:
-
The total number of agents
-
The tracked features and interactions
-
The overall feature-wise adoption percentage
The Agent-wise report is emailed to Agent Helper admins every morning at 10:00 AM (UTC) in the following format:
| Column | Description |
| Date (UTC) | The date when the agent used an Agent Helper feature (e.g., 02/28/2025). |
| Agent Name | The name of the agent who used the Agent Helper feature(s). |
| Feature Used | The specific Agent Helper sections, features, or console elements the agent interacted with on that date, separated by commas. |
| Usage Count | The number of times each feature was used. |
An example of the email report is shown in the image below.
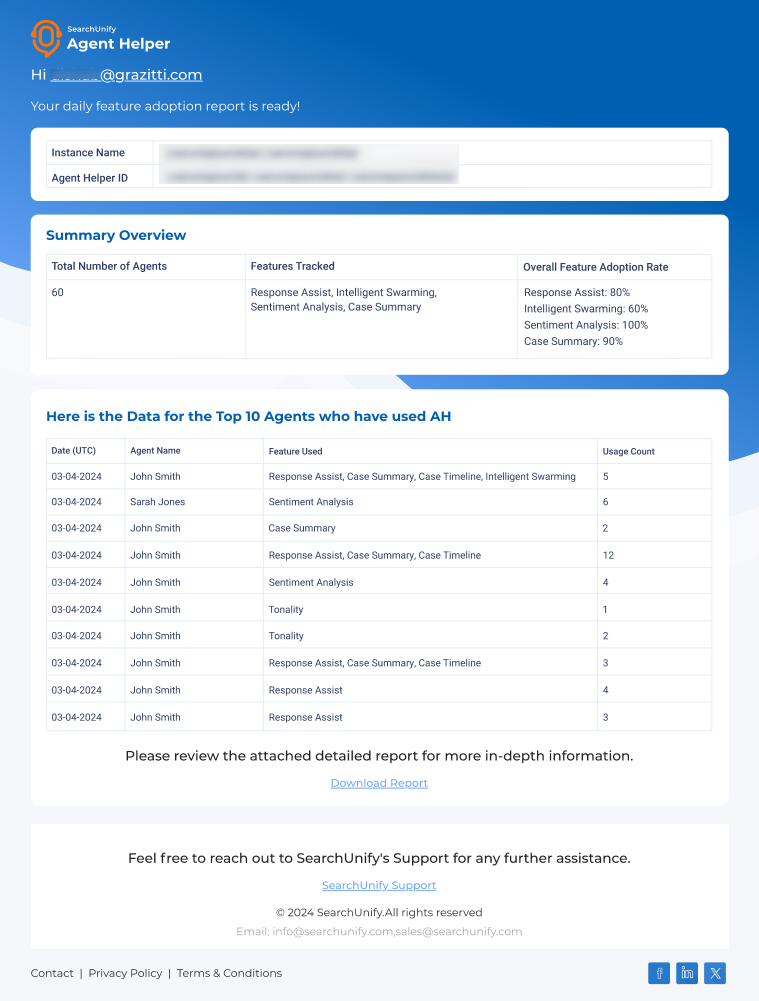
Fig: The above image shows the email template of Daily Feature Adoption report.
Note: The email only lists adoption metrics for the top 10 agents. To view the full report for all support agents, download the attached report.