

Agent Helper Analytics Overview
The Overview tab in Agent Helper Analytics provides Support Managers with a real-time, at-a-glance summary of case activity, resolution trends, agent engagement, and the overall impact of Agent Helper on support efficiency.
It consolidates key performance indicators (KPIs) such as total cases, closed cases, time-to-resolution, and feature usage to help teams assess performance, track adoption, and identify improvement areas.
Accessing the Overview Tab
-
Navigate to Analytics → Agent Helper Analytics.
-
Click the Overview tab.
-
Select a date range from the filter panel.
-
The default range is set to Last 30 Days (rolling).
-
You can also select Month to Date, Quarter to Date, or choose a Custom Range.
Note: Data is filtered based on case closure date to ensure that both case activity and Agent Helper usage occurred within the selected period.
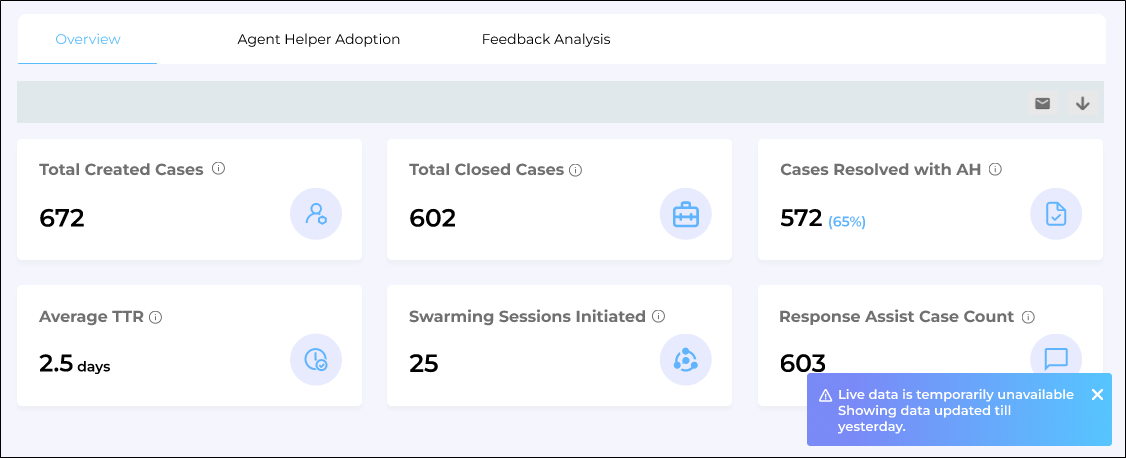
Fig: A snapshot of Agent Helper Overview screen.
-
Metrics
Total Created Cases
Displays the total number of support cases currently present in the CRM (all statuses). It is calculated using the Created Date of the case.
Total Closed Cases
Shows the total number of cases that have been successfully closed in the selected date range.
Cases Resolved with AH (Count & Percentage)
Displays both the count and percentage of closed cases where at least one qualifying Agent Helper feature was used before closure.
Formula

Qualifying Features
-
Response Assist (Copy to Clipboard used)
-
Case Summary (Regenerate used)
-
Swarming initiated (Slack/Email triggered via AH)
Note: For reopened cases, the initial closure event is always considered the official closure, regardless of how many times the case is reopened. Subsequent reopenings do not affect resolution metrics or time calculations.
Average TTR (Time to Resolution)
Displays the average number of days taken to resolve cases where Agent Helper was used.
Swarming Sessions Initiated
Shows the number of cases where Intelligent Swarming was triggered through Slack or email via Agent Helper.
Response Assist Case Count
Displays the number of distinct cases where a Response Assist response was copied; either via Copy to Clipboard or using Ctrl/Command+C.
Agent Engagement Report
The Agent Engagement Report provides valuable insights into the engagement levels of agents, who use Agent Helper, over a selected period. It helps to track adoption trends and identify agents who may need further training or re-engagement.
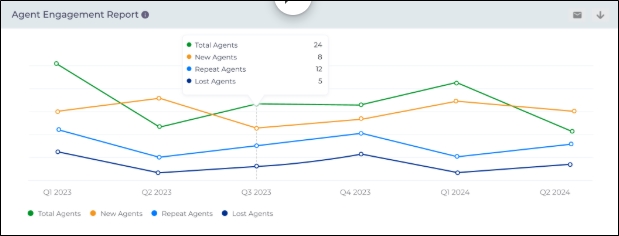
Fig: A snapshot highlighting the Agent Engagement Report
This report breaks down the number of agents into four categories:
-
Total Agents
The complete count of agents actively using Agent Helper during the selected period, regardless of their activity level or feature usage.
-
New Agents
Agents who started using Agent Helper for the first time during the selected period.
-
Repeat Agents
Agents who have used Agent Helper before and continued using it during the selected period, reflecting sustained engagement.
-
Lost Agents
Agents who were using Agent Helper previously but did not use it during the selected period, indicating a drop in engagement.
Agent-wise Adoption Overview
The Agent-wise Adoption Overview report shows how individual agents are using Agent Helper. Use this report to identify power users, coaching opportunities, and the impact of specific features on day-to-day case handling.
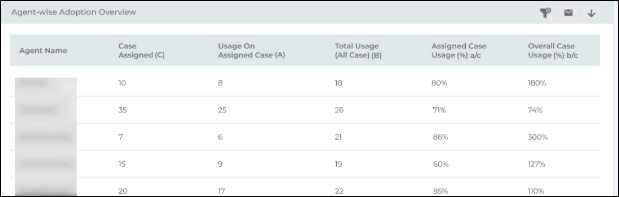
Fig: A snapshot highlighting the Agent-wise Adoption Overview Report
Filters and controls
You can refine the report using:
-
Feature filter (e.g., All, Case Summary, Case Timeline, Response Assist, AI Editor, Intelligent Swarming, Top Related Cases, Top Experts, etc.)
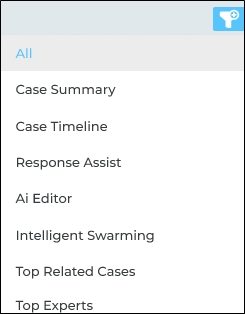
Note: Only one feature can be selected at a time. The table then shows usage for that specific feature.
The report shows the following details:
|
Agent Name |
The support agent whose adoption metrics you’re looking at.. |
|
Cases Assigned (C) |
Total number of cases assigned to that agent in the selected date range. |
|
Usage on Assigned Cases (A) |
Number of times the selected Agent Helper feature was used on cases assigned to that agent (within the date range). |
|
Total Usage (All Cases) (B) |
Number of times the selected feature is used by the agent across all cases they worked in the date range (including shared/swarmed cases). |
|
Assigned Case Usage (%) A/C |
Percentage of assigned cases where the agent used the feature, calculated as: ((A ÷ C) × 100). |
|
Overall Case Usage (%) B/C |
Overall feature usage relative to the agent’s assigned cases, calculated as: ((B ÷ C) × 100). |
How to interpret the metrics
-
High Assigned Case Usage % (A/C)
The agent is consistently using the feature on the cases they own. This usually indicates good adoption and alignment with the expected workflow.
-
High Overall Case Usage % (B/C)
The agent is using the feature frequently, including on shared or swarmed cases.
-
Values above 100% (B/C > 100%) typically mean:
-
The agent is actively helping on others’ cases (swarming / collaboration), or
-
They are using the feature multiple times per case (in Total Usage mode).
-
-
-
Low Assigned Case Usage % and Overall Case Usage %
May signal training needs, low familiarity with the feature, or cases where the feature is not being leveraged as intended.
Note: The metrics reflect data processed up to the previous day and may not include same-day activity.
Mean Time To Resolution (MTTR) Metrics
The Mean Time To Resolution Metrics chart shows the time saved in resolving cases when agents actually use Agent Helper (AH) compared to when they do not. It helps leaders and admins validate ROI and spot where AH is making the biggest impact.
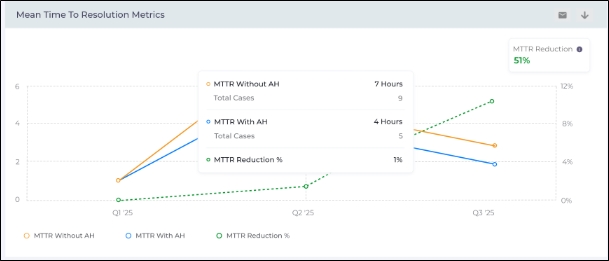
Fig: A snapshot highlighting the Mean Time to Resolution Metrics Report
The line chart displays three trends over time:
-
MTTR Without AH
Average resolution time for cases where Agent Helper was not used.
-
MTTR With AH
Average resolution time for cases where at least one valid Agent Helper action was applied on the case (for example: Response Assist copied into the reply, Timeline/Overview actions used, Regenerate applied, Swarming initiated, or Edit Response used).
-
MTTR Reduction %
The percentage decrease in MTTR when AH is used vs when it is not.
How MTTR % is calculated
MTTR Reduction % = MTTR Without AH - MTTR With AH ✖ 100
Note: MTTR data is refreshed once every 24 hours, so today’s activity will appear in the dashboard and CSV from the next refresh cycle.
Tags Trends Analysis Reports
The Tags Trends Analysis reports help support managers and admins analyze LLM-generated tags applied to support cases. Use this report to identify frequently occurring themes, observe tag trends over time, and detect sudden increases (spikes) that may indicate emerging issues.
Note: Currently, the Tags Trends Analysis reports show tag counts and analytics only. The option to drill down into the underlying case list will be available in a future release.
The report displays data according to the selected date range. You can further refine the results by applying filters such as Product and Agents.
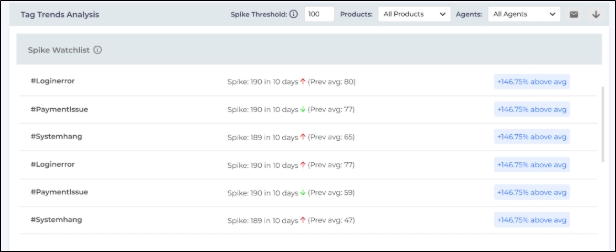
Spike Threshold
A tag is flagged as a spike when its Frequency Count exceeds the Spike Threshold (default: 100). You can adjust the threshold using the Spike Threshold drop-down.
There are three reports in the Tag Trends Analysis:
-
Spike Watchlist
-
Top 3 Combined Tags
-
Tag Frequency Analysis
Spike Watchlist
The Spike Watchlist highlights the top 20 tags that exceed the configured spike threshold (sorted by count). Spiked tags are marked with a red alert icon.
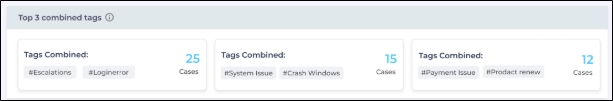
Top 3 Combined Tag
The Top 3 Combined Tags panel surfaces the most frequent tag combinations and the number of cases where those tags occurred together. This helps identify related issue patterns (e.g., tags that commonly appear in the same cases).
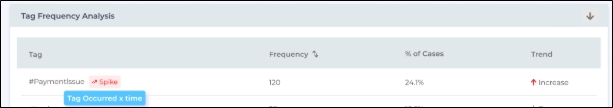
Tag Frequency Analysis
The Tag Frequency Analysis table lists tags with the following details:
-
Tag Name
-
Frequency Count (number of cases that include the tag)
-
Percentage of Total Cases
-
Trend (increase or decrease based on the selected date range)
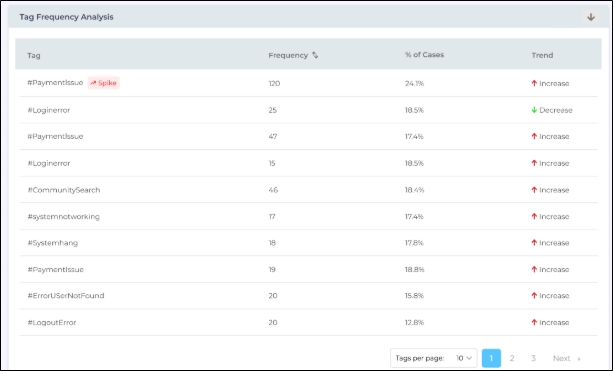
Hovering over the Spike icon shows the tooltip: "Tag occurred X times in the last N days."
Download Option
Click the Download icon or Email icon on the top-right corner of the Overview tab to export the data for offline review or reporting.
Note for Agent Engagement Report: If an agent is not available in the date range, it will display as N/A in the downloaded CSV export.