

Case Distribution Reports: Review Case Distribution Patterns
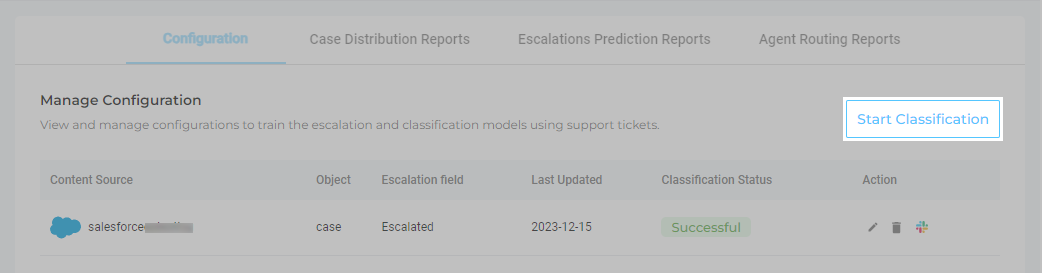
The Case Distribution Reports tab appears only when you click Start Classification in Configuration.

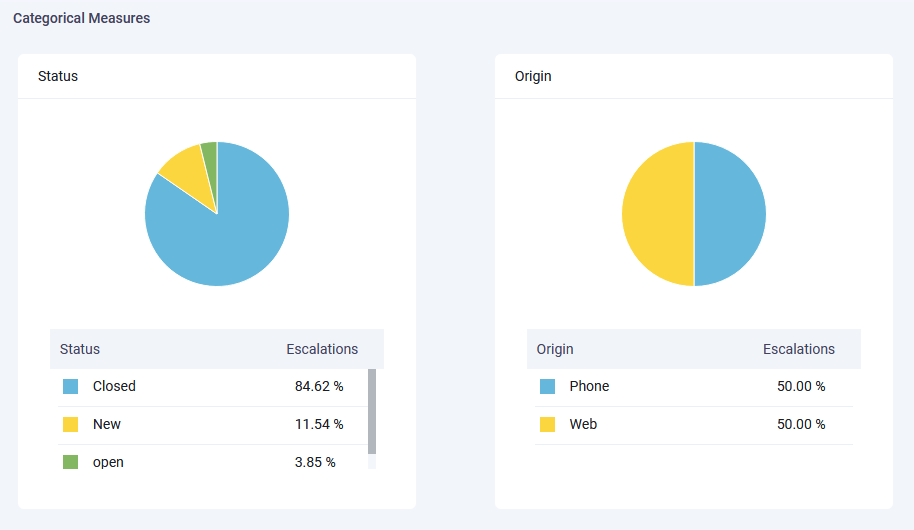
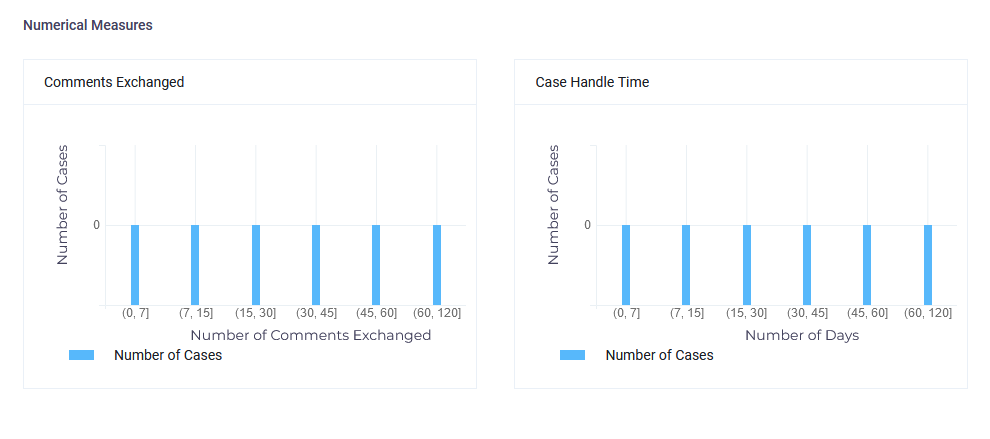
Based on the cases data in Textual, Categorical and Numeric, Case Distribution Reports generates visual reports. Review them to spot patterns. For instance, for an organization which prioritizes A, B, C, D, and E; if D is the largest then the cases with priority D are more likely to escalate. Also, the keyword cloud based on an analysis of case messages help you identify the triggers that suggest an imminent escalation.
The analysis run on cases today, and might or might not be relevant one month down the line. It's recommended to click Refresh, when case volume increases significantly. For instance, after inputting data of 100,000 cases, you might want to run Refresh when the number of cases increases to 110,000 or 120,000.
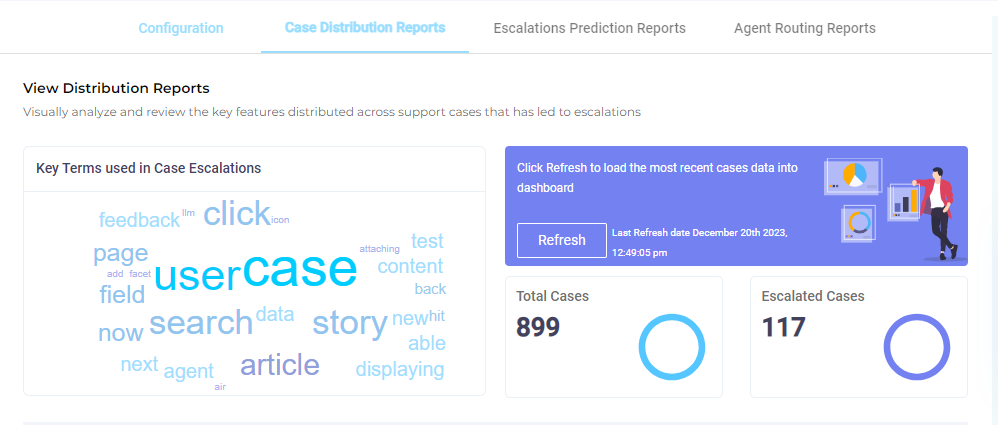
Scroll down to view them all.

