

LLM Usage Insights
In LLM Usage Dashboard, you can monitor token usage on LLMs.
PREREQUISITES
At least one active search client.
At least one active LLM integration with OpenAI
Access LLM Usage Dashboard
-
Expand Large Language Model and open Usage Dashboard.
-
The filters are Search Client and Date Range. You can use the filters to generate a report.
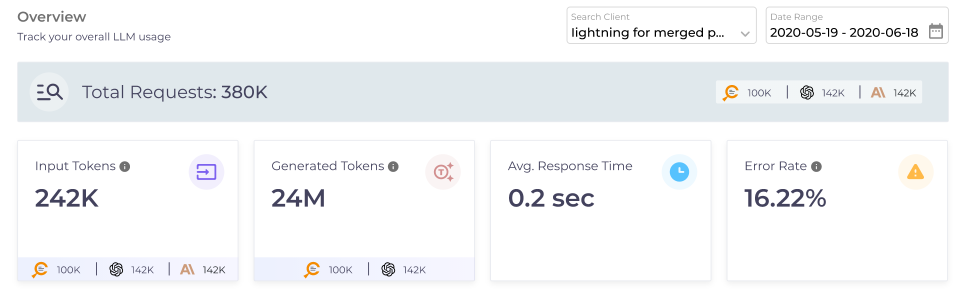
Overview: Total Requests
This part consists of four (or five tiles).
-
Input Tokens counts the total number of tokens shared from SearchUnify to an LLM. When multiple LLMs are connected, then the tokens shared with each LLM are counted separately at the bottom of the time.
-
Generated Token counts the total number of tokens used by an LLM to generate a response. When multiple LLMs are connected, then the tokens used by each LLM are counted separately at the bottom of the time.
-
Average LLM Response Time is the time spent on generating responses divided by the total requests.
-
Error Rate is the ratio of number of requests with errors divided by the total number of requests.
NOTE.
The tile Integration can be seen only when multiple LLM integrations are in use.
API Consumption
NOTE.
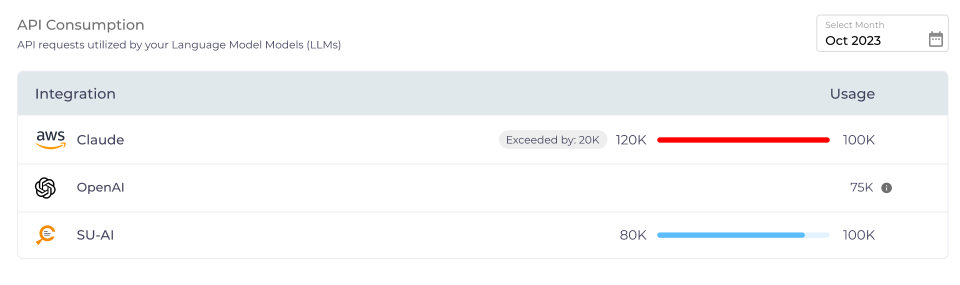
The bar mapping the tokens used against the available tokens is only available for Claude AI and SU AI.
Each SearchUnify customer gets a certain number of tokens each month. You can monitor token usage for the current month or for any of the previous six months in the API Consumption section.
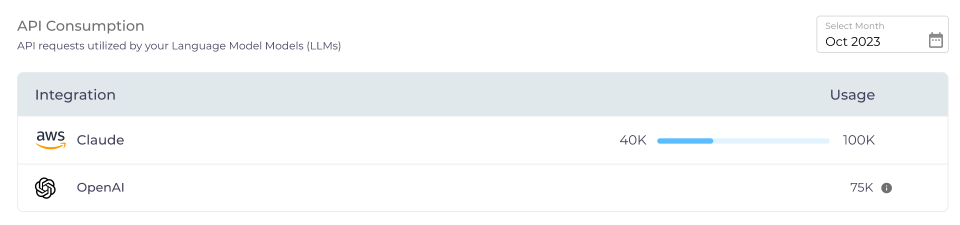
When token usage in a given month is way less than the allocated number, then the bar is green.
It turns blue as the monthly usage moves near the allocated number.
Once the token consumption matches or exceeds the quota in a month, then the bar turns red.
You receive an email when the 100% of the monthly token quota has been consumed. The emails are also sent when the consumption is 50% and 90% of the quota.
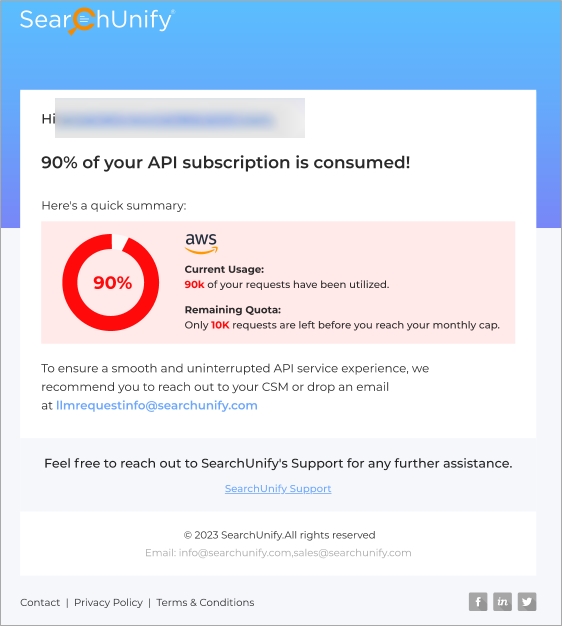
When the token usage hits 90% of the allocated quota, then a CSM will reach out to you.