

Average Click Position
Average Click Position measures the overall effectiveness of search results.
A search client can return a million results in response to a search query but if the users have to navigate to page 7, 19, or 173 to find intended documents, then something has gone terribly wrong. It's probably the time to perform some optimization by clever sprinkling of keywords, boost the correct content sources or documents, or educate users on how to search efficiently.
To monitor search relevancy for a specific keyword, check out Click Position Report.

Key Measures
A way to find out how useful search experience is to monitor clicks. When a bulk of the users are clicking the first, second, third, or tenth result; then you can safely assume that the results are relevant. On the other hand, if users navigate to page two and beyond and find documents, then it doesn't bode well for search experience. Average Click Position helps you find out when it's the time to take action.
NOTE.
In case you want to dive down and discover the keywords for which most clicked documents aren't in the top 10, check out Click Position Report
In Average Click Position, two metrics are measured: the number of clicks and the average position of the results that were clicked. If a user clicks on result two and then result seven, then total clicks is 2 and the sum of positions is 2 + 7 = 9. To obtain Average Click Position, the positions are added and then divided by the total number of clicks.

From our example where the user clicked results two and seven, Average Click Position can be calculated as in the following algorithm:

NOTE.
In the equations, Position signifies the rank of the clicked search result. If a user clicks on the 10th result, then Position is 10.
Average Click Position is not a constant. You can view how it is changing over time using the Date Range filter in Search Analytics. To cite an example, if Average Click Position is 6.5 in January and rises to 7.5 in February, then share of irrelevant results in search has gone up. However, if Average Click Position drops to 3.1 in March from 7.5 in February, then search experience has improved significantly.

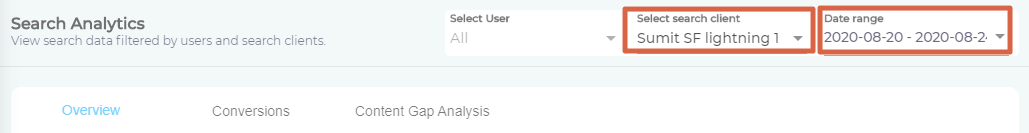
To compare, how different search clients are performing on this metric, use the Select Search Client filter.

Navigate to the Report
- In Search Analytics > Overview, select a search client and time period from Select Search Client and Date Range respectively.
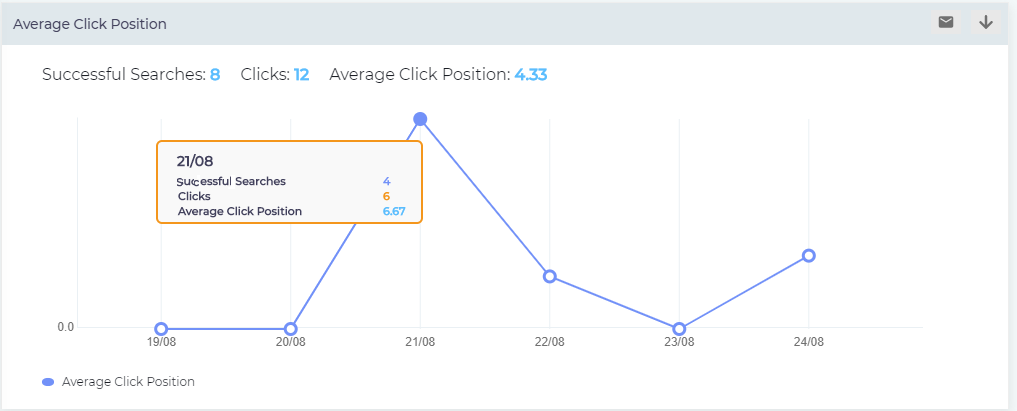
- Scroll down to Average Click Position.
- Hover the cursor over any point to view the exact number of Successful Searches, Clicks, and Average Click Position for that day, week, or month. Successful Searches is the number of total searches minus the number of searches with no click and the number of searches without results. The formula is Successful Searches = Total Searches - (Searches with No Clicks + Searches without Results). The interpretation will depend on Date Range. If Date Range exceeds a month, then each point represents a month. If Date Range is longer than week but shorter than a month, then each point on the line stands for a week. For a Date Range shorter than a week, each point is a day.
Download or Share
Check out Download and Share an Analytics Report
Related
- Back to Overview
- Related article on Click Position Report