

Click Position Report
Click Position Report measures the relevancy of results on a search client for individual keywords. To view the overall effectiveness of search results on a search client over a period, check out Average Click Position.
Understanding the Report
The most relevant results for any keyword ought to be served first. Search tuning can be used if that's not the case. But how does an admin know in the first place that users have to scroll down to, say, result 8 or page 3 to find a document. Click Position Report to the rescue, which calculates the mean position (Average Position) and mode position (Most Clicked Position) of clicked results for a query.
| Search Session 1 | Search Session 2 | Search Session 3 |
| Activity 1: Search "laptop". | Activity 1: Search "laptop." | Activity 1: Search "computer" |
| Activity 2: Click a result on position 6. | Activity 2: Click a result on position 3. | Activity 2: Click a result on position 5. |
| Activity 3: Select a facet. |
Activity 3: Search "computer". |
Activity 3: Search "laptop." |
| Activity 4: Click a result on position 3. | Activity 4: Click a result on position 7. | Activity 4: Click a result on position 3. |
| Activity 5: Clear all facets. |
Activity 5: Select a facet. |
Activity 5: Click a result on position 5. |
| Activity 6: Click a result on position 5. | Activity 6. Select a result on position 5. | SESSION END. |
| SESSION END | SESSION END. |
After reviewing the sessions, here's what we learn about the click positions for keywords "laptop" and "computer."

Most Clicked Position for "laptop" is three because this position occurs the most times in the data.

Most Clicked Position for "computer" is 5 because this position occurs the most times in the data.
Most Clicked Position tells you where users find a document. If the position is, let's say, 7, then you can apply tuning and boost the document to position 1, 2, or 3. In the case of Most Click Position being greater than 10, apply tuning immediately. Any Most Click Position greater than 10 suggests search experience is being affected negatively.
NOTE.
What will be the Most Clicked Position for data: 5, 7 and 3?
Find the Report
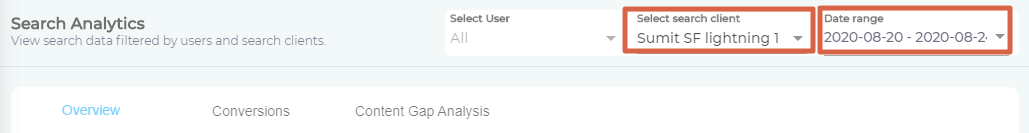
- Select a search client and time period from Select Search Client and Date Range respectively.
- Scroll down to Click Position Report.

Read the Columns
- #(n). The number is parenthesis is the count of unique search queries.
- Search Query. This column lists unique search queries. Irrespective of how many times "laptop" is searched over a given time period, it will be listed only one.
- #Sessions. The number of sessions in which a query is searched.
- #Searches. This number of successful searches, i.e, the searches after which at least one click was made by the user.
- #Clicks. The sum of clicks made for a query across all the sessions. The report, by default, is sorted on the basis of clicks. Top clicked searches are at the top.
Most Clicked Position
The position of the most clicked search result for a query. For details, scroll up to the table.
Average Position
The average position of the results for a query. In statistics, it's called mean. The formula for mean position is:

NOTE.
A difference between the Average Position column and Average Click Position report is that in the latter all the positions for all the successful queries are added and divided by the sum of successful searches but in the former only the positions for a specific query in question are added and divided by the successful searches for that particular query.
Download or Share
Check out Download and Share an Analytics Report
Related
- Back to Overview
- Related article on Average Click Position