Download and Share an Analytics Report
Search Analytics reports can be downloaded for offline viewing and shared via email with individuals who do not have access to your SearchUnify instance. The reports are comma-separated files (CSV), compatible with Microsoft Excel, Google Sheets, and other programs that support CSV format.
NOTE
If you are downloading reports for use in Tableau, a faster option is to Export Search Analytics Data to Tableau.
Run a Report
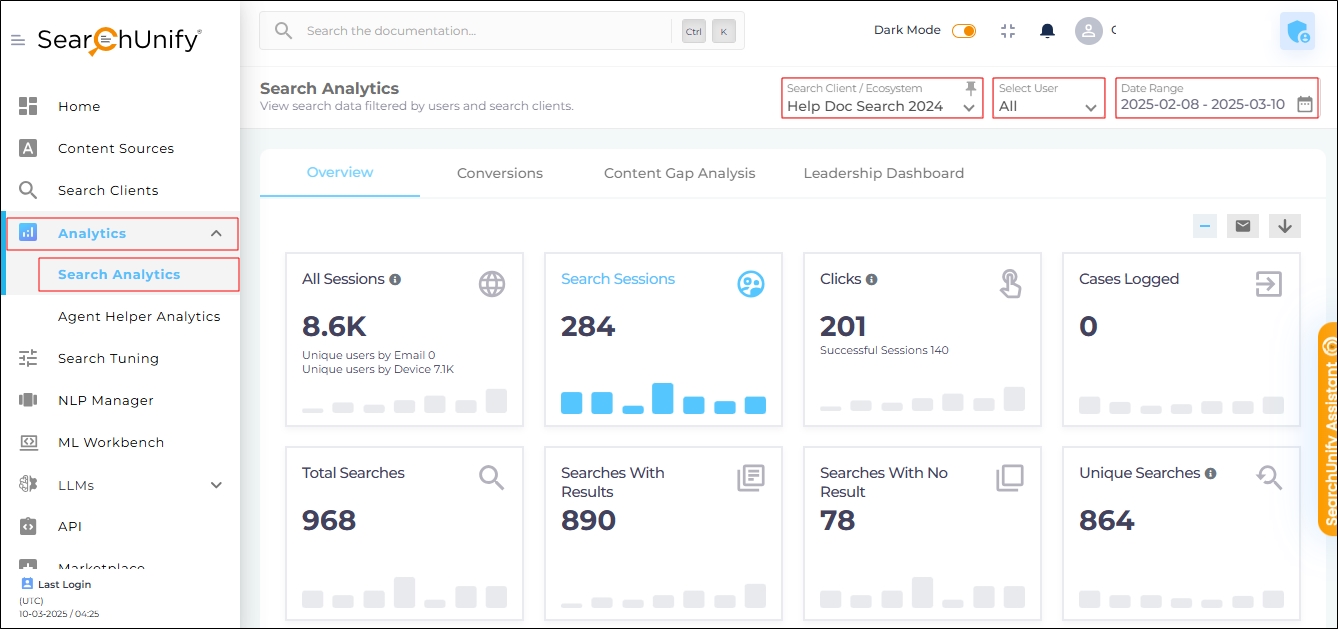
Before downloading or sharing a report, it’s recommended to run it using the three parameters available in the top-right corner of Search Analytics:
- Search Client / Ecosystem - If you have multiple search clients or ecosystems, select the one whose data should be included in the report.
-
Select User. Search Analytics categorizes users into three categories:
-
Internal Users – Logged-in users with an email address from your company domain (e.g., user@yourcompany.com).
-
External Users – Logged-out users or users logged in with an external domain (e.g., user@othercompany.com).
-
Hybrid Sessions – Sessions where a user logs in or out midway, resulting in some activities being performed as an internal user and others as an external user.
The Select User dropdown has four filters:
-
Internal – Displays analytics for internal-only and hybrid sessions.
-
External – Displays analytics for external-only and hybrid sessions.
-
External Only – Tracks activities exclusively for external users.
Example: If a logged-in user performs 9 searches, then logs out and conducts 5 more searches, the External Only filter will report only the 5 searches made after logging out.
In contrast, the External filter would report all 14 searches.
-
All – Includes analytics data for internal-only, external-only, and hybrid sessions.
-
- Date Range - The default range is one month. It can be narrowed to a single day or expanded up to 180 days.
Fig. A snapshot of the Search Analytics filters.
Download a Report
NOTE.
Inactive Sessions Are Not Exported – Sessions with no activity are excluded from exported reports. As a result, the total session count in the Admin Panel may be higher than in the downloaded report.
Total Searches May Differ – The total number of searches in a downloaded file may be slightly higher than what is displayed in the Admin Panel when Include Advanced Facet Details is enabled.
This occurs because some entries in the Text Search column are duplicated—the first row includes facet details, while the second does not.
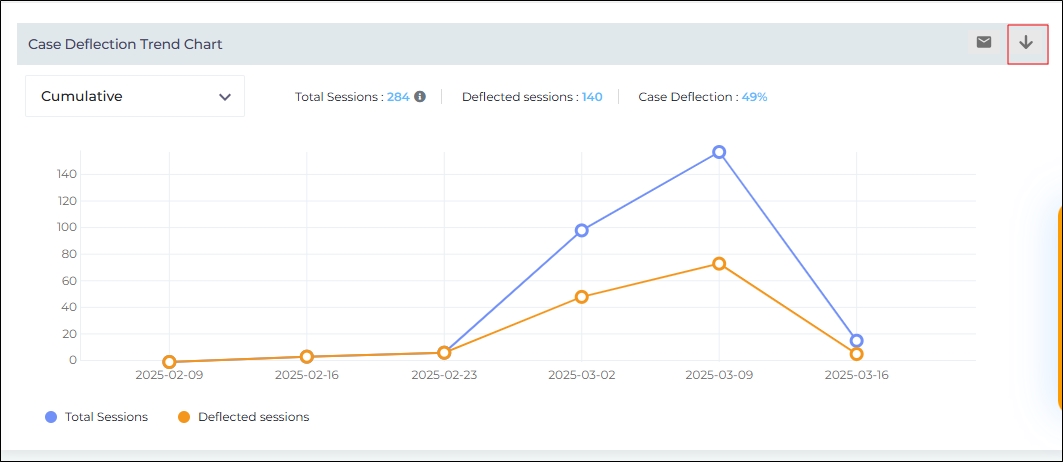
After running the reports, locate the one you want to download in Overview, Conversions, Content Gap Analysis or Leadership Dashboard, and click the download button.
Fig. A snapshot of the download button on an analytics report.
Open a Downloaded Report
-
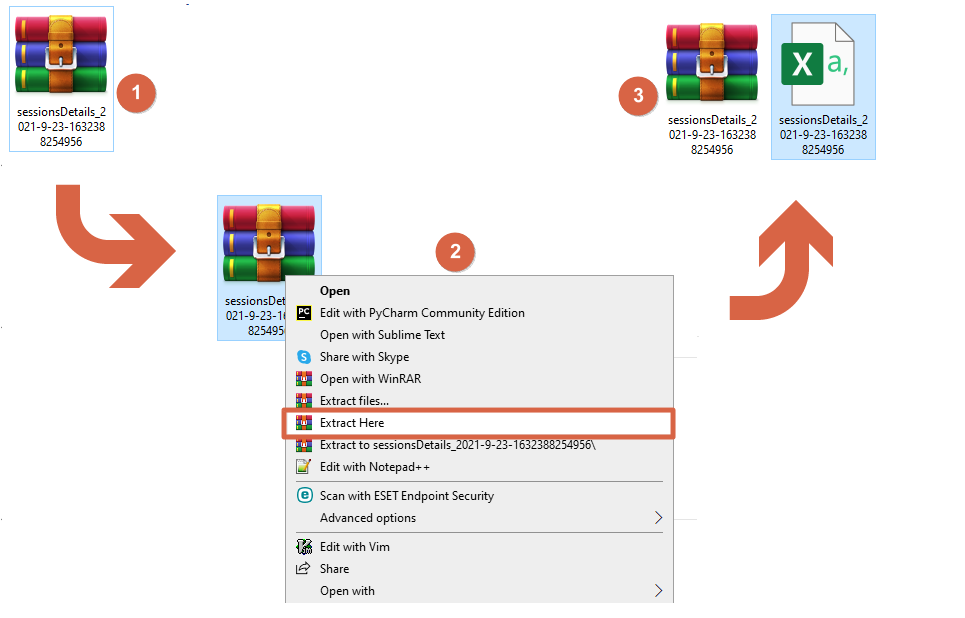
Reports are downloaded as zipped CSV files. To open a report, first unzip the file.
-
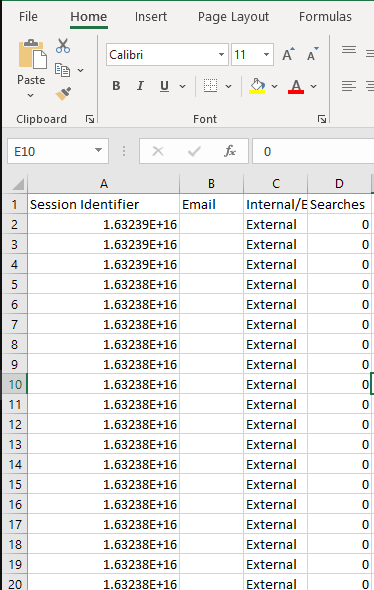
Use Excel or any program that supports CSV files to open the report.
-
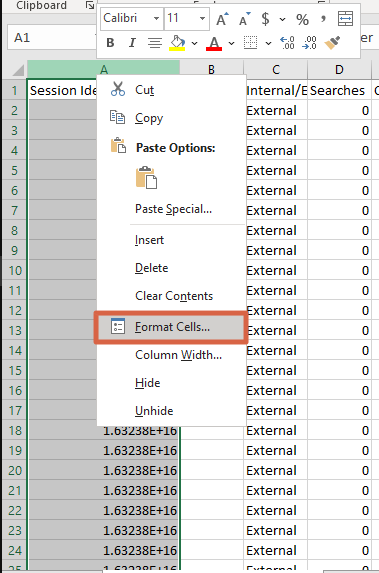
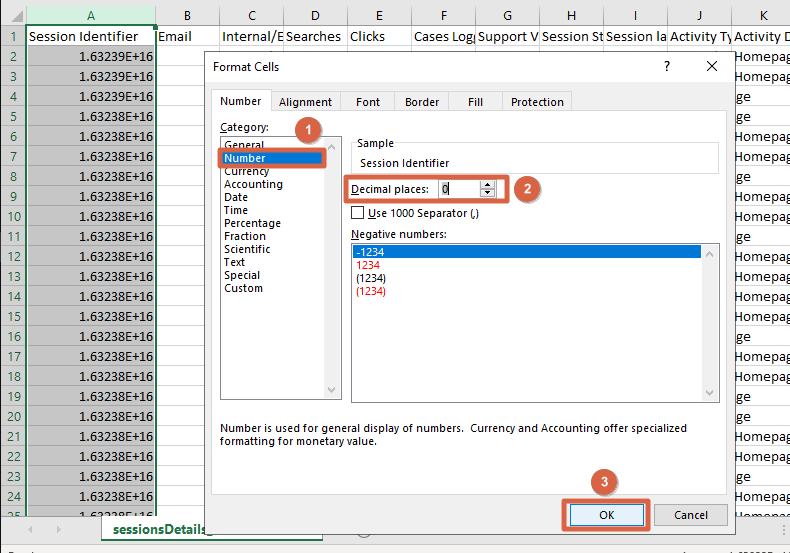
If you open the Session Analytics Details report, the Session Identifier column may display numbers in scientific notation.
-
To display date and time fields correctly, apply your preferred date and time format in Excel.
However, if a date field contains more than 15 digits, Excel may not format it correctly.
In such cases, upload the file to Google Sheets and apply your preferred date and time format there.
Share an Analytics Report
NOTE.
The shared report may not show immediately in your inbox if the SearchUnify server is busy. In such cases, you will see a message that your report is in queue. The message is displayed at the lower-right corner of the Admin Panel as soon as you click Send. We recommend that you wait for some time and your report will be delivered soon.
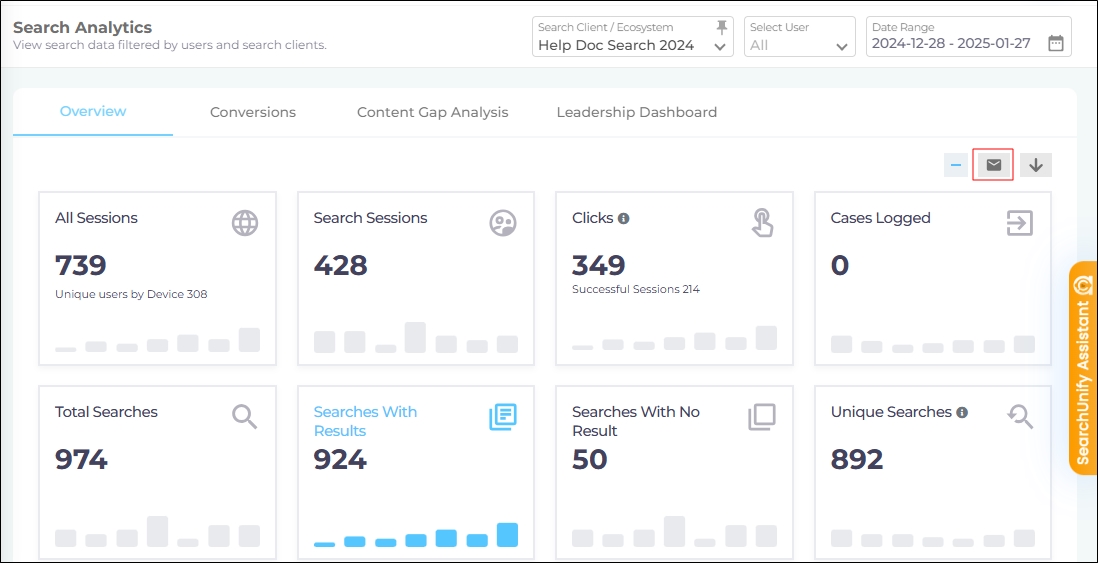
Navigate to a report whose data you want to share and click on the Email icon.
Fig. A snapshot of the share-on-email icon on the Search Analytics tab.
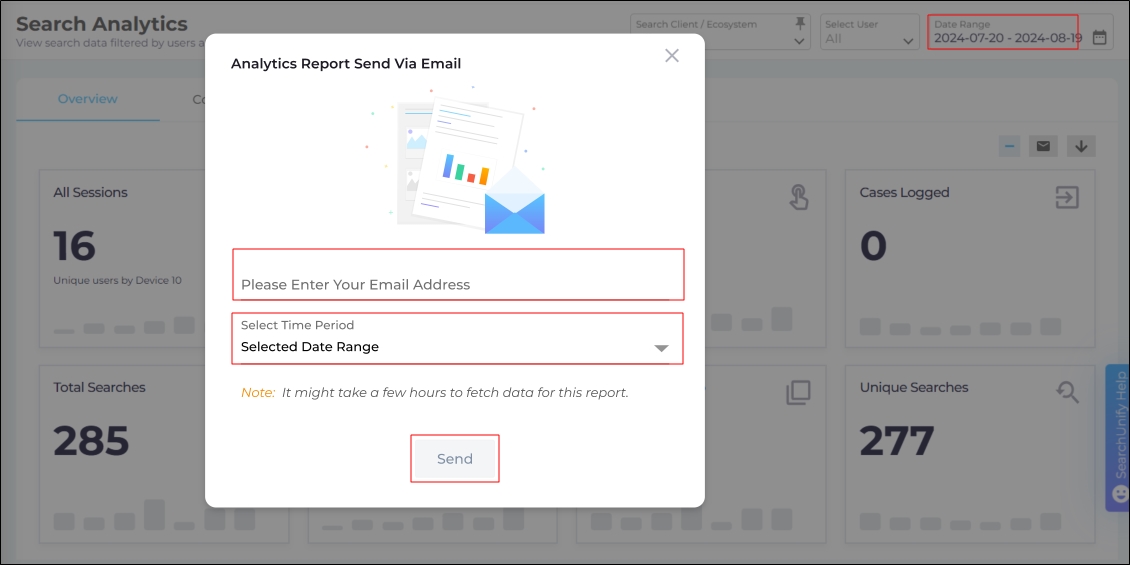
A pop-up opens when you click on the Email icon. Enter the following information in the pop-up:
-
Please Enter Your Email Address: To send the report to yourself, leave the field blank. To share it with others, enter the recipient's email address. You can include multiple email addresses by separating them with commas.
Tip: Press Enter after typing an email address to save it.
-
Only for five reports, the Select Time Period filter appears: Select any one option:
-
Selected Date Range: Send data for the range specified in the Date Range dropdown. This is the default option.
-
Last 6 Months: Send data from the past six months.
-
Last One Year: Send data from the previous year. (For example, if the current year is 2025, the previous year is 2024.)
-
Two Years Prior: Send data earlier than two years. (For example, if the current year is 2025, two years earlier will be 2023.)
The reports for which the filter is available are:
-
Tiles in Overview
-
Case Deflection Trend Chart in Conversions
-
Tiles in Content Gap Analysis
-
-
Click Send.
Fig. A snapshot of the Analytics Report Send via Email dialog.
Download Sessions Tracking Details
When downloading the Session Tracking Details report, three additional fields appear alongside Email:
-
Select Date Format
-
Activity Count
-
Advanced Facet Details
These fields allow you to customize how data appears in the downloaded report.
Select Date Format
You can choose how dates and times appear in the report:
-
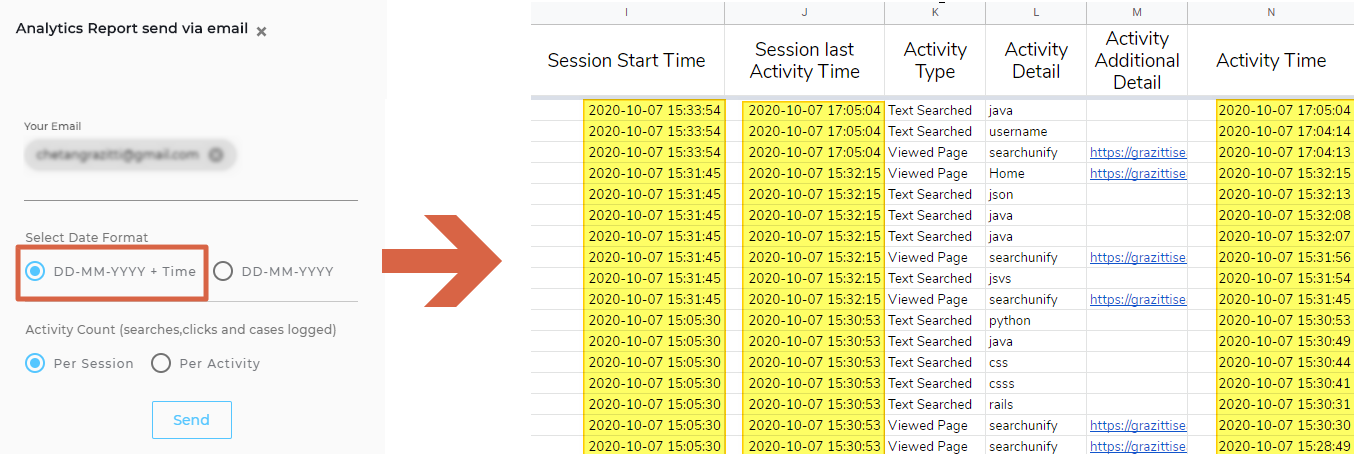
Selecting DD-MM-YYYY + Time will display session start time, session end time, and activity time in the report.
Fig. A snapshot of the analytics report when "DD-MM-YYYY + Time" is selected.
-
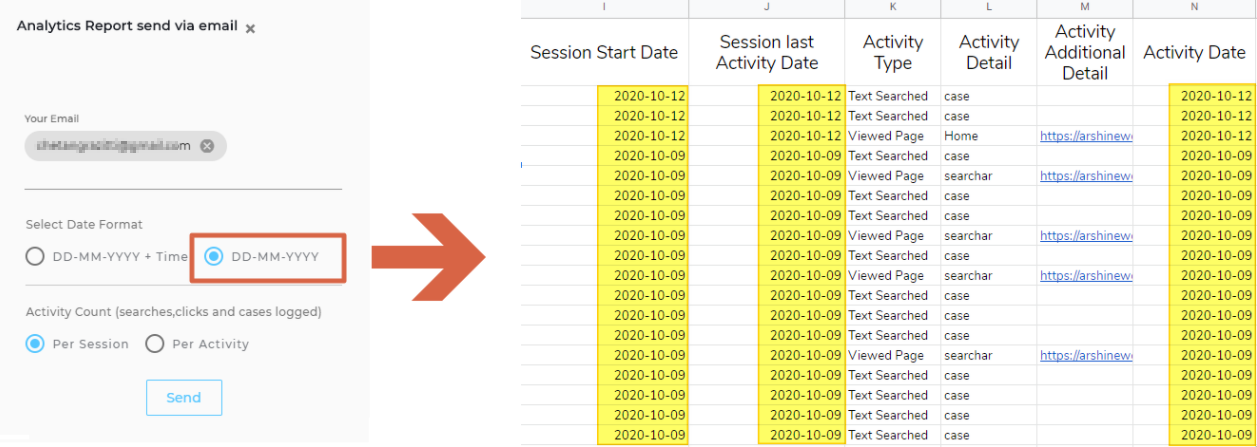
Selecting DD-MM-YYYY will remove the time component, displaying only the date.
Fig. A snapshot of the analytics report when "DD-MM-YYYY " is selected.
Activity Count
By default, each session row repeats key session details, including:
-
Searches
-
Clicks
-
Cases
To read a session, start from the lowest row and read upwards. The next image is a report of session 1602160226239364, in which
-
A user visits a page
-
Visits support
-
Performs a search
-
Visits support again
-
Clicks a search result
-
Runs a search
-
Logs a ticket
-
Searches again
-
Logs a ticket
Then the session ends.
In this journey, the user
-
Searched three times (steps 3, 6, and 8)
-
Clicked on a search result once (step 5)
-
Logged two tickets (step 7 and 9)
The information on searches, clicks, and cases is repeated in all the nine rows of the session.
This view has an advantage that a mere glance at any session row reveals the searches and clicks performed and the cases logged in that session.
Fig. A snapshot of the analytics report when "Per Session" is selected.
For those interested in tracking specific activities per row, the Per Activity format is available.
Instead of repeating the total in every row, Per Activity view assigns:
-
1 (Yes) when an activity occurs
-
0 (No) when an activity does not occur
The same session (1602160226239364) is in the new format is in the next image.
Fig. A snapshot of the analytics report when "Per Activity" is selected.
Include Advanced Facet Details
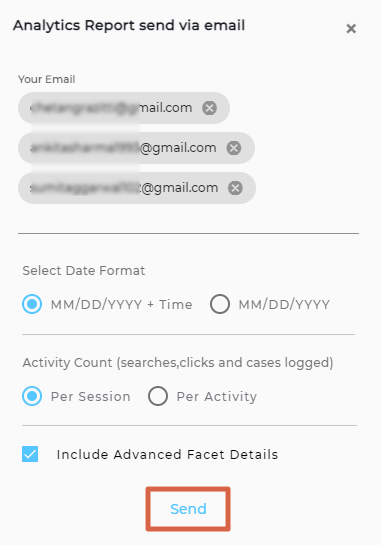
Facet details can be downloaded and shared. To use this feature, simply click Include Advanced Facet Details. Six facet details columns will appear in the downloaded report:
-
Facet ID – Internal identifier for a Facet Type.
-
Facet Type – Groups related facets (e.g., content sources, date ranges).
-
Facet Value – The selectable options within a facet type (e.g., 2021-01-01, 2021-10-01 in Created Date).
-
Exact Phrase – Extracts the phrase enclosed in double quotes from an advanced search query.
-
Example: If a user searches # search "clients", the term "clients" appears in this column.
-
-
With One or More – Captures terms that must be included in the search.
-
Without the Words – Captures terms that must be excluded (preceded by a minus sign in a query).
-
Example: If a user searches # search -client, the term "client" appears in this column.
-
NOTE.
The total search count in the Admin Panel may be slightly lower than in the downloaded file when Include Advanced Facet Details is selected.
This occurs because some entries in the Text Search column are duplicated—one row contains facet details, and the other does not.
Fig. A snapshot of the analytics report when "Include Advanced Facet Details" is checked.
After mentioning your preferences, click Send. Check your inbox—the report will arrive in a zip file.
Fig. A snapshot of the Analytics Report Send Via Email dialog.


