

KCS Usage Analytics
KCS Usage Analytics monitors metrics that can be used to quantify the impact of KCS on your support team’s efficiency. The impact, measured in terms of article shares, can be converted into hours of effort and dollars saved.
Here’s a hypothetical scenario. An agent spends, on average, an hour to solve a repeat ticket. Now, if the agent, a technical writer, and an approver spend 8 hours collectively to transform a ticket into a published article and over the course of a year following its creation, the article is shared 20 times, then the support team can save 12 hours because instead of repeating a solution on phone or typing it in a mail, the agent can simply paste the link to the published article in response to the repeat ticket.
The savings, both in dollars and in time, add up quickly when multiple agents and hundreds of articles are involved.
Going over the report at regular intervals, you can also get a handle on who among your agents is most active in drafting the most shared articles.
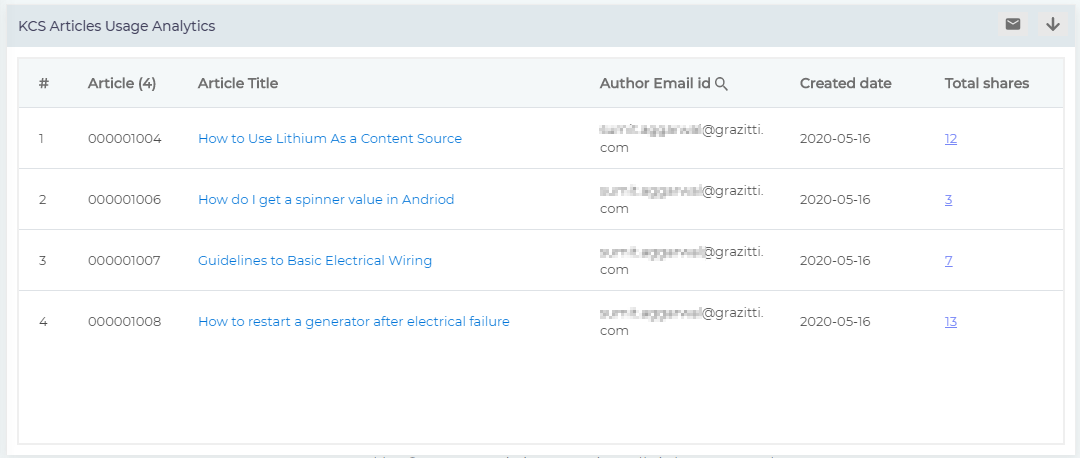
Fig. 1
The report is sorted by article IDs which are to be found in the first column, Article (#). The octothorpe represents the total number of articles published. In Fig. 1, four articles have been published with the IDs 000001004, 000001005, 000001006, and 000001007.
Article Title serves two functions: A quick survey of this column provides a reader a gut feeling about the kind of articles being created and a search function (Fig. 2) helps a reader quickly pull up any article and see how many times it has been shared.
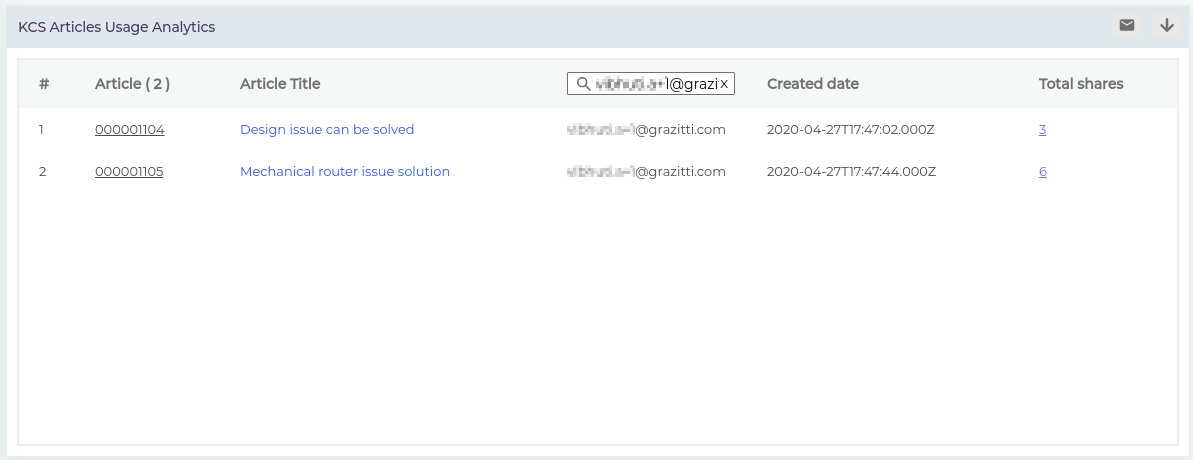
Fig. 2
In the Author Email Id field are captured the email addresses of the support agents who are drafted in the articles. In Fig. 1, you can spot that both the articles are drafted by sumit.aggarwal@gmail.com.
Created Date displays the date of creation of the article.
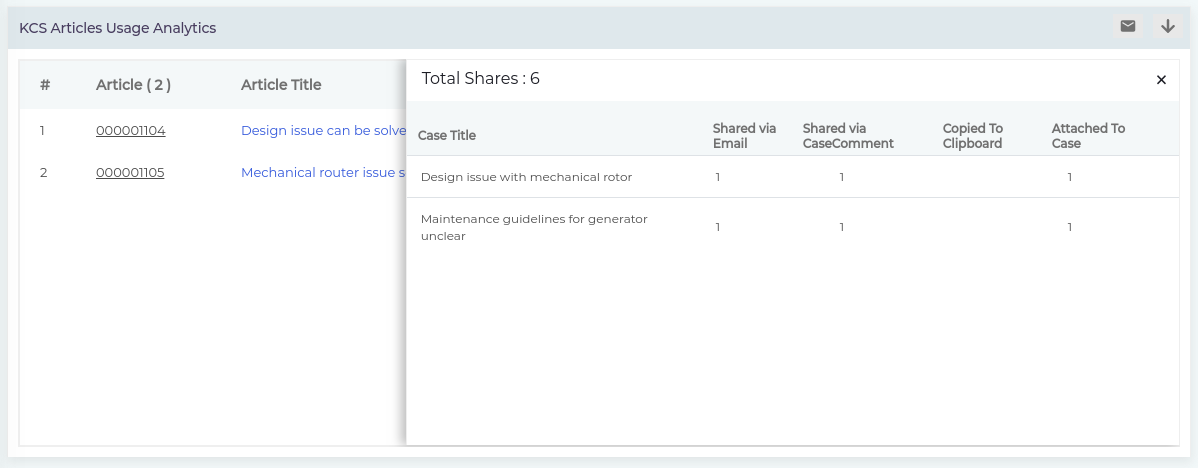
Fig. 3
If measuring productivity is your goal then Total Shares is the column you should keep an eye on. It displays the share count of each article. The number field in each row is clickable and can be utilized to further find out:
- ONLY FOR SALESFORCE CLASSIC. What cases the article was attached to (Case Title; column 1 in Fig. 3) Whether the article emailed (Shared via Email; column 2 in Fig. 3), posted as a comment on a case page (Shared via Case Comment; column 3 in Fig. 3), attached to a case (Attached to Case; column 5 in Fig. 3).
- ONLY FOR SALESFORCE LIGHTNING. The fourth column, Copied to Clipboard, captures the events when a link to an article is copied, which happens when any of the three sharing options is exercised: email, case comment, or case attachment. It’s sufficient to select an option, the actual sharing doesn’t necessarily have to occur.
The last column Article Origin lists the case ID for which an article is created.
IMAGE
Download or Share
Check out Download and Share an Analytics Report
Related Document