Search Analytics
Stay on top of search and content usage data with Search Analytics, which captures more than 30 search and content metrics—including total searches, conversions, cases created, popular articles, and case deflections—to find patterns in search activity, uncover the information needs of users, and assist admins perform thorough content gap analyses. The data on metrics, streaming in from search clients, reflects in SearchUnify Analytics within 120 seconds of their being captured.
The reports are placed into three categories:
Overview
- Search Summary. A graph to view search trends. The default view is for five weeks but it can be changed using the Date Range filter.
- Search Report. Gives insights into how particular search queries are handled on the search client.
- Search Index by Content Source. Find out which content source has the most documents in your search index.
- Newly Added Content Sources. Track the growth of your content sources over time. The newly added documents are presented in a bar chart.
- Top Rated Featured Results. This report measures the performance of featured snippets.
- Top Rated Graph Tiles. This report lists the most popular knowledge base articles.
- Content Experience Feedback . Measures how helpful your documentation is. The responses from the widget are collected in this report.
- Search Experience Feedback. Obtains feedback on search relevancy. Supports both textual feedback and rating.
- Cases Created Report. This report displays all cases logged on your ticketing platform (such as Salesforce or Zendesk).
- Average Click Position. A report designed to help you understand the overall relevancy of your search results.
- Click Position Report. This report helps to check the relevancy of your search results for individual keywords. Gives you the position of the most clicked result for a given keyword.
- Advertisement Performance Report.This report helps you analyze the impact of your advertisement(s) including impressions and clicks.
- SearchUnifyGPT™ Feedback Report. This report gathers feedback that users leave on the SearchUnifyGPT™ widget on search clients.
- SearchUnifyGPT™ Engagement. This report measures search user interaction with answers generated by SearchUnifyGPT™ across in three tabs: Read Answers, Citation Clicks, and Copied Answers.
Conversions
- Session Tracking Details. Find out how users engage during sessions. Click any ID to view detailed user activity in that session.
- Search Filter Based Clicks. Captures the content sources, content types, and content fields filters that users apply to get relevant answers. Shows the most popular content sources first.
- Unsuccessful Case Deflection. Lists articles that users consulted before logging a case on the support page.
- Successful Case Deflection. Lists articles that user consulted and didn't log a case.
- Most Popular Documents. View the most clicked articles. The report links each article with sessions, keywords, and users.
- Top Clicked Searches. Lists the popular clicked queries. Each query is mapped with clicked articles.
- Attached to Case. Find out the cases most frequently linked to cases by support agents in their communication with users.
- Discussions Ready to Become Help Articles. This report identifies popular discussion topics that have not been documented. Content managers can use the list to prioritize knowledge generation.
- Share Results Analytics. Get detailed information on article sharing patterns on a SearchUnify Salesforce Console search client. Only for Salesforce Console users.
Content Gap Analysis
- Unsuccessful Searches. This graph shows searches with no results and no clicks in a selected time period. Helps to track keywords that do not generate any search result.
- Sessions with Unsuccessful Searches. This bar graph compares the number of unsuccessful sessions on a weekly basis.
- Searches with No Click. Lists queries for which users didn't click on any result.
- Searches with No Result. Lists queries for which users didn't find any result.
- High Conversion Results Not On Page One. Shows frequently-clicked results not on page one.
- Documents By Content Length. This report shows a list of documents, articles, or pages in a search index with their corresponding character count.
- Articles Usage by Agents. A report for Zendesk and Salesforce consoles where you can find the list of agents who attach articles to cases from the SearchUnify search client and the number of articles each agent has attached.
Leadership Dashboard
-
Unassisted Self Solve Volume provides insights into how effectively knowledge base articles deflect cases.
-
Assisted Case Volume quantifies the role of knowledge base articles in solving cases.
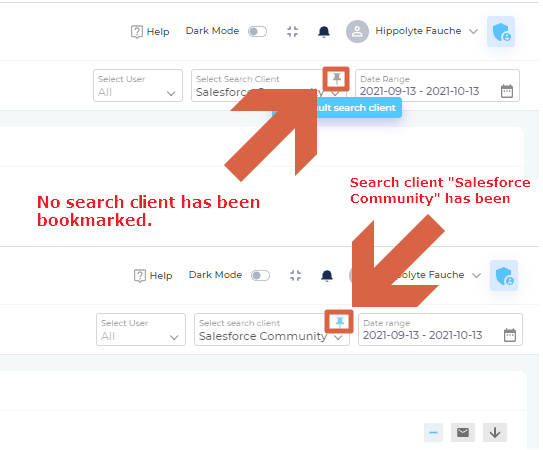
In each category, except the Leadership Dashboard, the reports can be filtered by user type, search client, and time. If you view data for a search client often, you have an option to bookmark or pin that search client by clicking ![]() in the Select Search Client dropdown. When pin turns blue when a search client has been pinned.
in the Select Search Client dropdown. When pin turns blue when a search client has been pinned.
The Date Range dropdown is fixed, which means that it remains accessible when you scroll down to view reports. However, on changing the search client from Select Search Client, you are navigated to the top of the screen once again.


